Difference between revisions of "BCAL reconstruction 01/16/2012"
(→Z resolution) |
(→Z resolution) |
||
| Line 22: | Line 22: | ||
[[Image:Zdiff histo6.png]] | [[Image:Zdiff histo6.png]] | ||
| + | |||
| + | Curve is a fit to a sum of two gaussians. Some points are distributed as expected with a sigma of ~12 cm, but approximately half have a much large sigma. For very small E, and for much larger E, the distribution looks more like a single Gaussian. | ||
Revision as of 17:04, 16 January 2012
Look at individual DBCALPoint = upstream hit + downstream hit in same BCAL cell, with energy corrected for attenuation, z determined by time difference of the two hits.
Can get "truth" information about how much energy deposited and where from DBCALTruthCell. Since these correspond to SiPM cells, must sum several DBCALTruthCell to correspond with one DBCALPoint.
Compare DBCALPoint with sum of corresponding DBCALTruthCell 's.
Z resolution
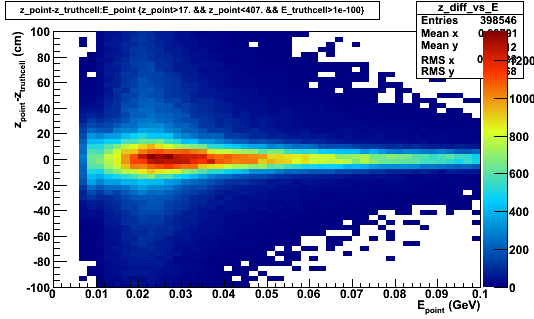
Can look at z-resolution (z_point-z_truthcell) vs E_point:
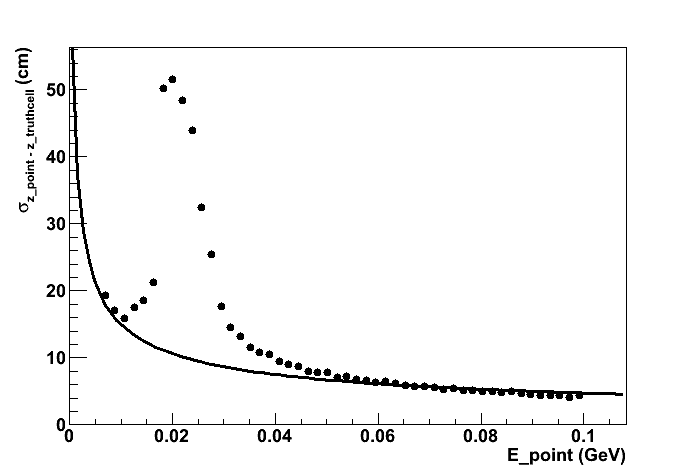
Below are the sigmas of the (z_point-z_truthcell) distributions for different slices of E:
The curve shown is 1.5 cm/sqrt(E), which is already higher than the nominal z-position resolution, sigma_z = 1.1 cm/sqrt(E) .
Something strange going on here ???
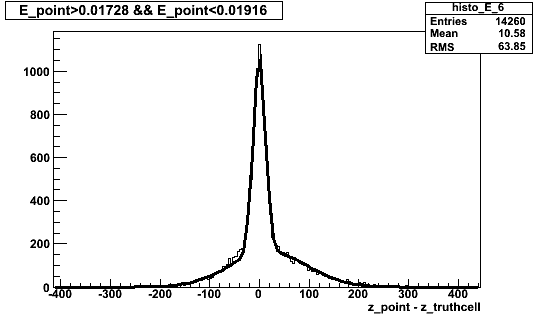
Below is (z_point-z_truthcell) for a range of energies in the anomalous region shown above:
Curve is a fit to a sum of two gaussians. Some points are distributed as expected with a sigma of ~12 cm, but approximately half have a much large sigma. For very small E, and for much larger E, the distribution looks more like a single Gaussian.


