CDC 19 12 2007
Some news on tracking
To see if the tracking code is working i looped over data containing almost 4 days of cosmics. Three or more hits are required for a track, a line
 is fit. In the coordinate system that i use, the
  axis points up and the
  axis goes from left to right.
In figure 0.1 one can see spectra of the fit parameters.
One can see that A has its mean around zero =>  , these lines point upwards in my coordinate system => makes sense because the that is the way cosmics are supposed to travel and the scintillators for the cosmic trigger are oriented in that way.
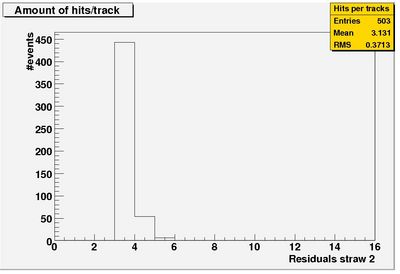
In figure 0.2 one can see the amount of hits/track, it is mostly three: to calculate the resolution in a standard way we need at least four hits/track. Notice the lack of statistics, even after almost four days of data taking - we increased the HV in the hope the efficiency improves. We'll also take date over Christmas and new year.
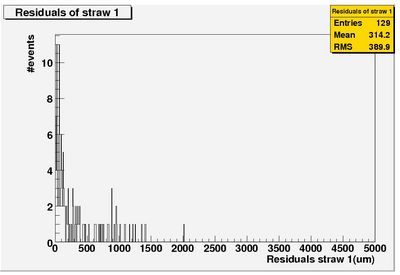
Figure 0.3 shows the residuals of channel 1, more statistics are needed.
The rate is 0.0720 cosmics per second or 4.3 cosmics per minute.
Interposer, preAmp, and signal cable
This is the continuation of CDC_12_12_2007.
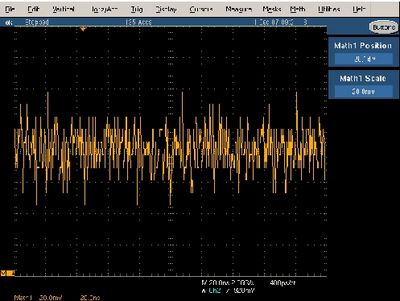
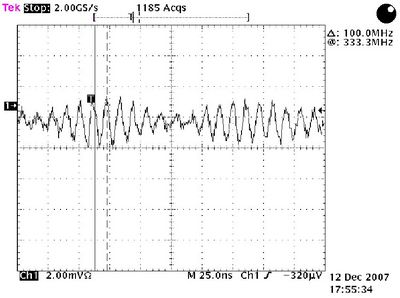
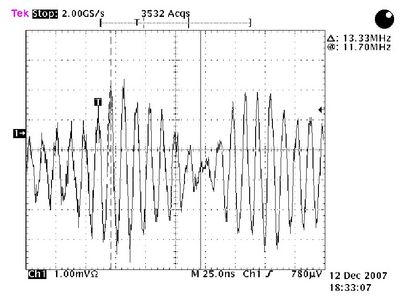
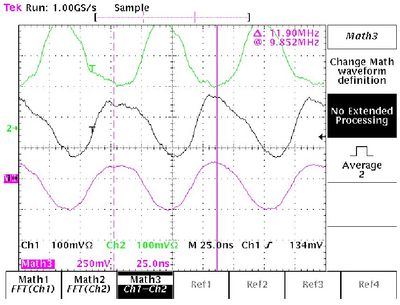
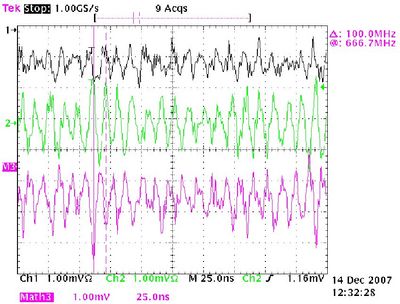
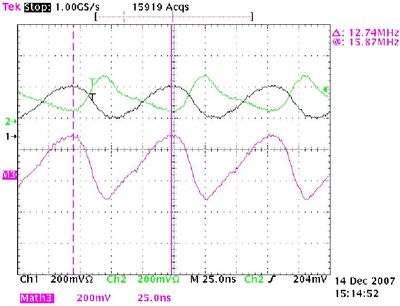
Thanks to Fernando we have a new reference measurement; he measured the noise of the interposer+preAmp+signal cable: his measurement is shown in figure 1.
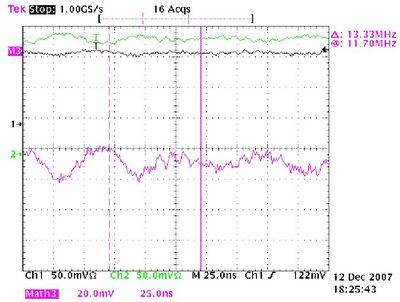
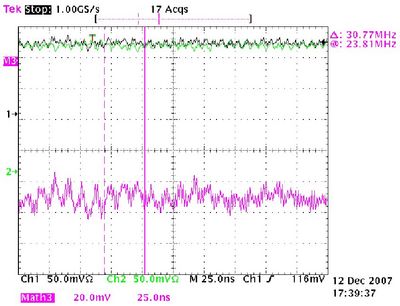
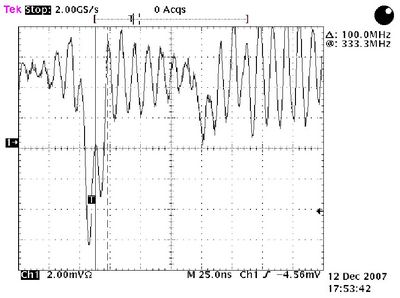
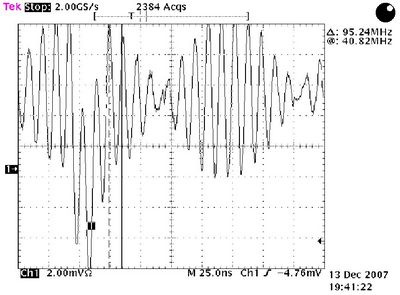
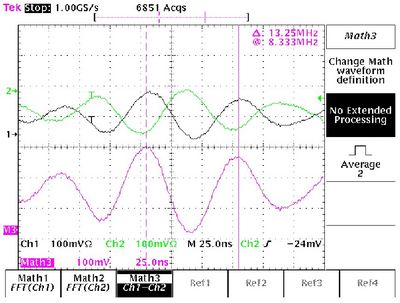
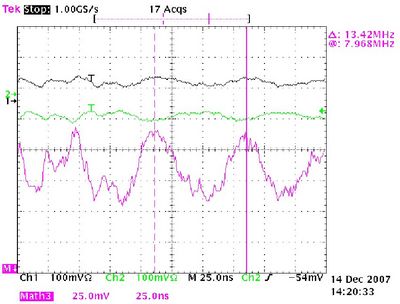
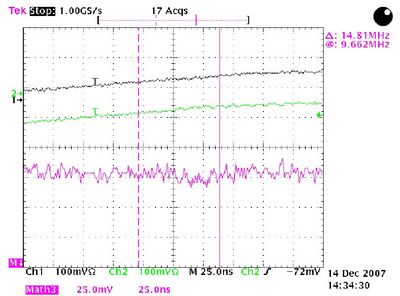
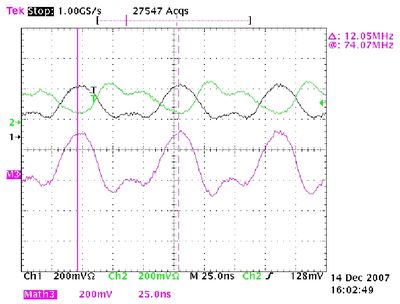
The differential signal was measured with the cable between the CDC-straw-wire and the HV-distribution board disconnected on the CDC side. The measured signal is shown in figure 2.
No oscillations are observed! If one compares to figure 1 the comparison is reasonable, but I think Fernando has a better oscilloscope!
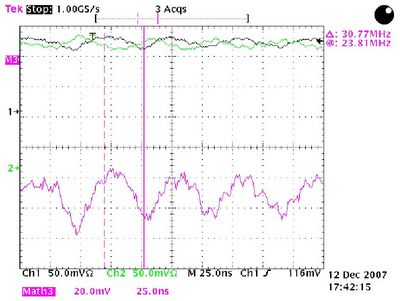
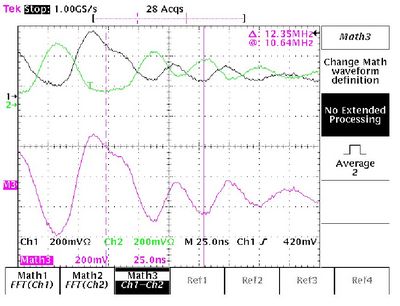
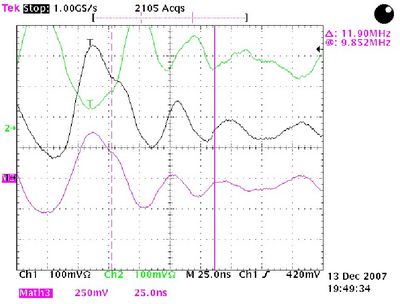
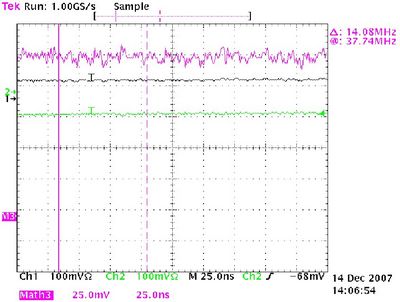
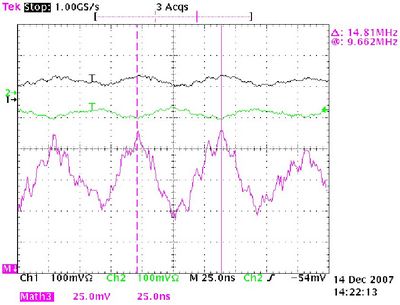
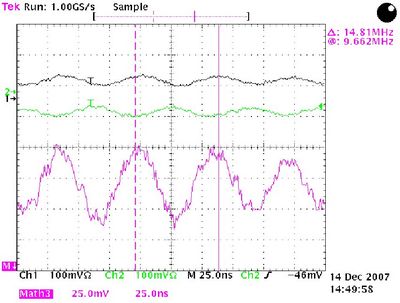
For the sake of completeness, the cable between the CDC and the HV distribution board was also disconnected on the side of the HV-board, this signal can be seen in figure 3.
Again, no oscillations.
Conclusion: the oscillations are caused by the input signals on the preAmp. What follows are several measurements performed to acquire a better understanding of the situation.
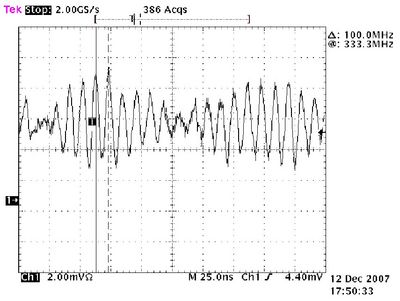
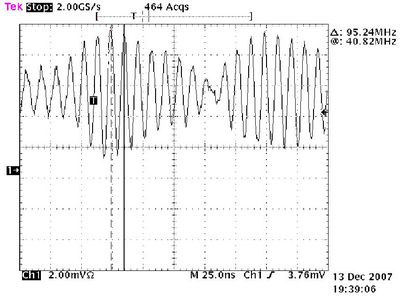
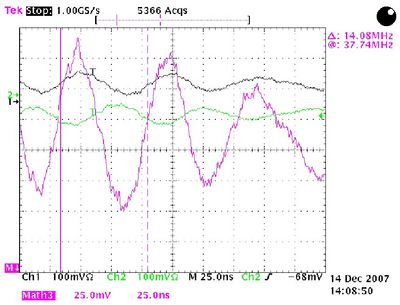
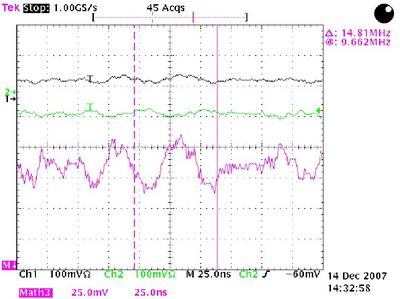
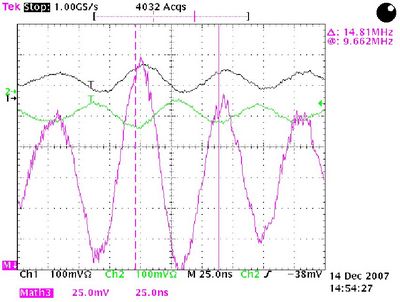
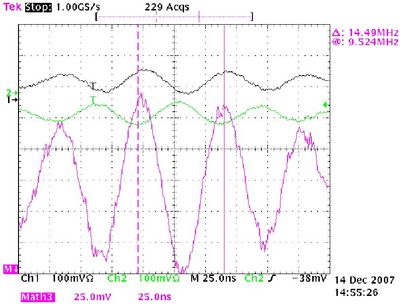
Now all previous measurements were taken with HV power supply switched, off let's repeat the measurement showed in figure 3 but now with HV switched ON (the supply was always connected to the HV distribution board). The result is shown in figure 4.
The shape of the noise looks different but the amplitude does not change.
How do the noise/signals look like directly from the CDC-wire? Let's start with the noise, we have to points where we can measure: on the cable going from the CDC-straw-wire to the HV distribution board and directly behind the capacitor that decouples the signal from the HV. In figure 5 the noise is shown measured directly on the cable, notice that the HV has to switched off in order to perform this measurement.
This looks OK to me. Let's see how it looks after the capacitor on the HV distribution board: this is shown in figure 6.
One can see that the amplitude increases - also there is a baseline offset. What can cause the offset? Well in figure 6 the preAmp is switched on, in figure 7 the same is measured but now with the preAmp switched off (LV set to zero).
Well, the base line moved closer to zero, mark that the vertical scale in figure 7 is different than figure 6.
Let's look at the signals. After putting 1800 V on the CDC and placing my probe after the capacitor that decouples the signal from the HV I was not able to distinguish a signal in the noise, i had to increase the HV till 2130 V till I was able to see the signal showed in figure 8.
How could it be that the previous pre-Amp could see nice signals at 1800 V -> did it filter out the 100 MHz noise somehow? I am planning to try a suggestion made by Gerard to double the capacitance of the capacitor that decouples the signal from the HV, see how much it improves the signal/noise situation. Anyway, figure 9 shows how this signal (showed in figure 8) looks like after the (new) preAmp.
The signal is barely visible.
How are the cables connected between the CDC and the HV-distribution board. The ground of these coax cables is floating (not connected to anything), the inner part of the cable is connected to the HV distribution board and a straw-wire. The HV board layout can be found here: CDC_28_11_2007 (go to the end of the page).
Fernando suggested to solder the shielding of the coax cables sitting between the field-wire and the HV board to the HV-line on the board. This work was finished today and some measurements were taken:
- ) Noise: figure 10 shows the noise measured at the capacitor, figure 11 after the preamp.
- ) Signal (2170 V on the wires): figure 12 shows a signal measured at the capacitor, figure 13 after the preAmp.
Conclusion: nothing changed, soldering the shielding to the HV line on the HV board did not improve the situation.
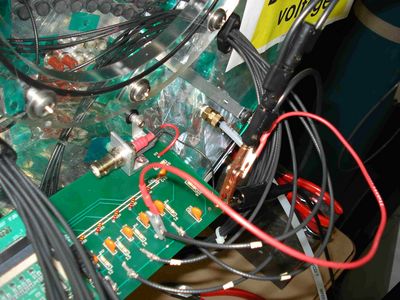
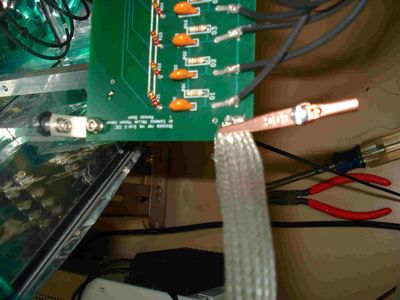
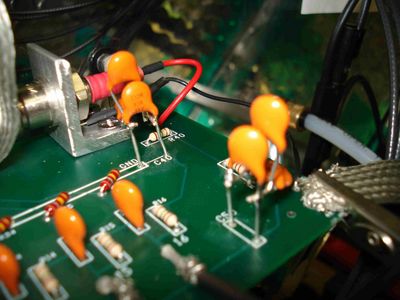
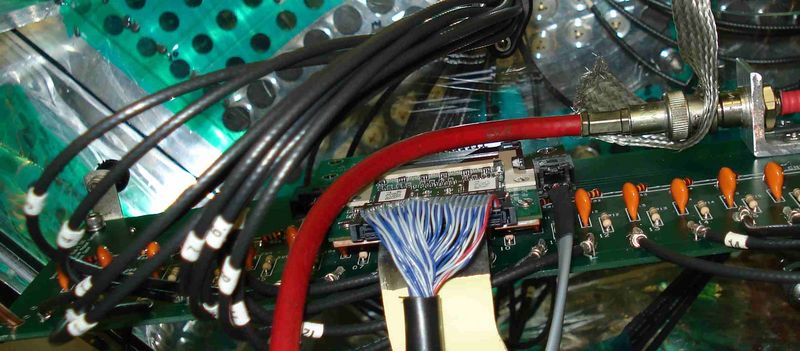
In picture 1 a picture of the capacitors (330 pF) that are used on the HV board is shown.
A couple more suggestions were made by Fernando and Gerard, i'll go over them one by one as they were performed = in cronological order.
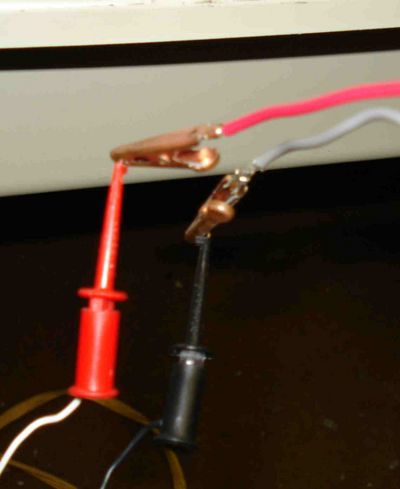
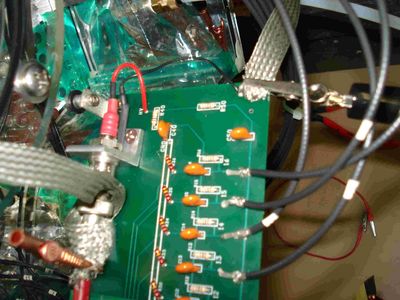
Probe test: always a good idea: are mi probes working? How the probes are connected can be seen in picture 2, the signal coming from this probes is shown in figure 14.
The scope traces that are shown in following figures are always after the preAmp.
Next step: disconnecting the HV cable from the HV board (I did not remove the ground connections between HV-board and CDC-endplate), signal shown in figure 15, notice that the time scale is different as in figure 6 in CDC_12_12_2007, if the same time scale is used the same signal is observed.
Step 2: disconnecting the 15 completely on the HV board side. In figure 16 the signal from channel 15 is shown, in figure 17 the signal from neighboring channel 16.
Next step: connect the cable shield of channel 15 to the ground of the HV board. This is shown in picture 3, signal of channel 15 is shown in figure 18, signal of channel 16 in figure 19.
Next step: disconnect channel 15 on the CDC side. How this connection is achieved can be seen in pictures (picture 3 and 4). I took signals of many combinations:
1) cable shield channel 15 connected to ground: figure 20
2) cable shield channel 15 floating: figure 21
3) cable shield channel 15 connected to the HV line on board: figure 22
4) cable of ch 15 connected to CDC: figure 23
5) neighboring channel 16: figure 24
Beefing up the ground, see picture 4,5 and figure 25 for the signal --> HV cable reconnected.
Changing capacitors, it required some boy-scout soldering: 3 capacitors of 330 pF were soldered in parallel, see picture 6. For the signal see figure 26.
Picture 7 shows the new preamp mounted on the HV-board.
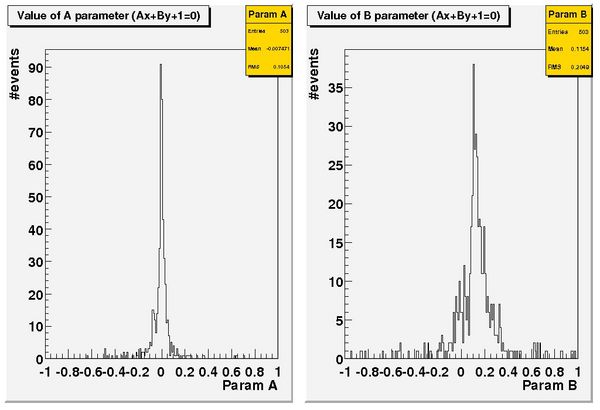
 , right: spectrum of fit parameter
  .
.