Difference between revisions of "Setup and tests"
From GlueXWiki
m (→Pedestal) |
m |
||
| Line 50: | Line 50: | ||
|- | |- | ||
|} | |} | ||
| + | |||
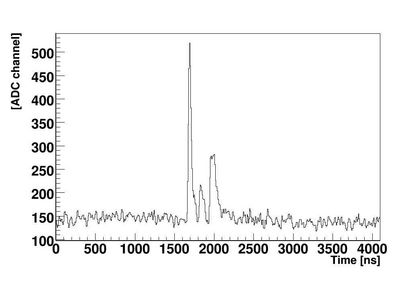
| + | = Some sample signals = | ||
| + | {| border="1" cellpadding="2" | ||
| + | |- | ||
| + | |width="415pt"|[[Image:sample1.jpg|thumb|none|400px|Raw signal.]] | ||
| + | |width="415pt"|[[Image:sample2.jpg|thumb|none|400px|Raw signal.]] | ||
| + | |width="415pt"|[[Image:sample3.jpg|thumb|none|400px|Raw signal.]] | ||
| + | |- | ||
| + | |} | ||
| + | |||
| + | |||
= Energy spectra (not tracked) = | = Energy spectra (not tracked) = | ||
Revision as of 18:30, 21 January 2009
Contents
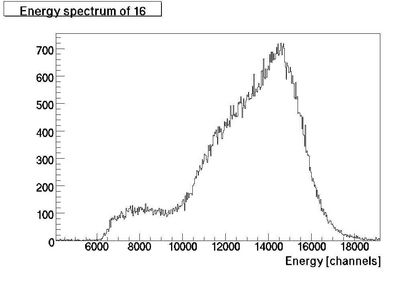
First Fe-55 spectrum
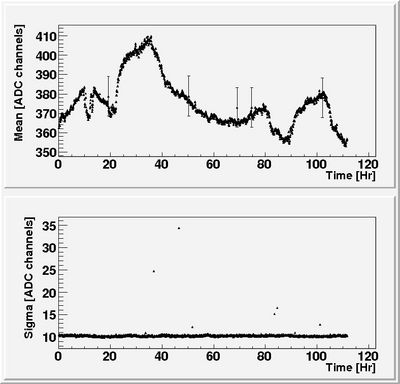
Pedestal
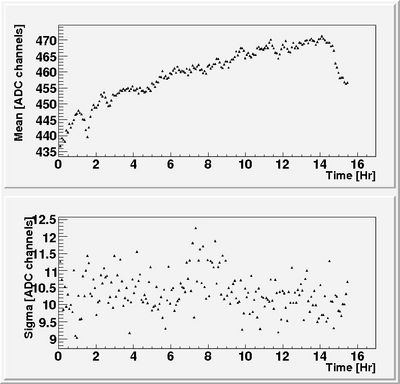
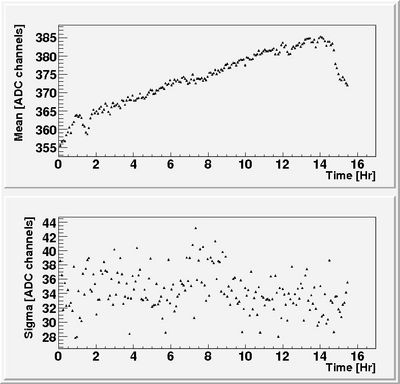
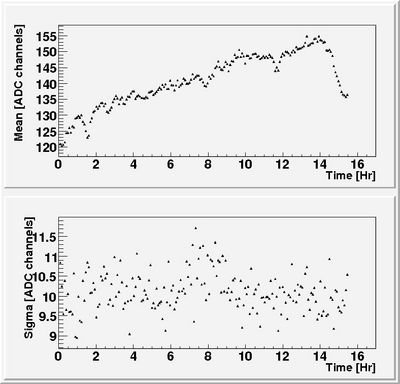
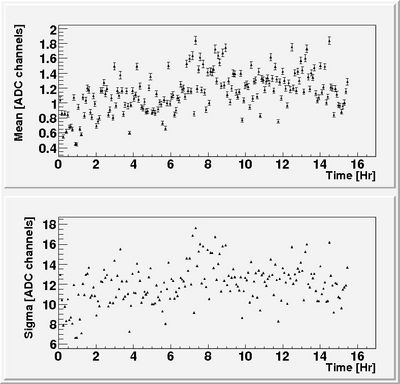
Pedestals when the HVB is connected to the CDC
Pedestal vs time (1000 event runs) is plotted.
Channels 12-13-14 show some (signs of) problems:
Pedestals when HVB is not connected
Pedestal vs time (1000 event runs) is plotted.
Channels 12-13-14 show some (signs of) problems:
Some sample signals
Energy spectra (not tracked)
