Difference between revisions of "PS Rate Monitor"
From GlueXWiki
| Line 8: | Line 8: | ||
* On the main GUI screen select scalers update time using ''' Update Timer''' window and press ''' Start''' button. | * On the main GUI screen select scalers update time using ''' Update Timer''' window and press ''' Start''' button. | ||
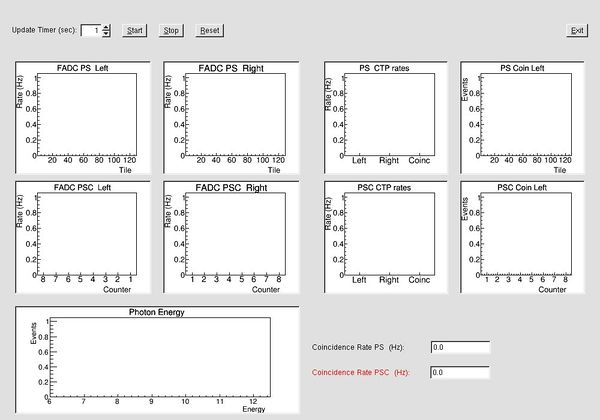
| − | * The coincidence rate between two detector arms for the PS and PSC will be displayed in | + | * The coincidence rate between two detector arms for the PS and PSC will be displayed in "CTP rate" plots and |
: also printed in "Coincidence rate" windows. | : also printed in "Coincidence rate" windows. | ||
[[Image:Ps_rate_monitor.jpg|600px ]] | [[Image:Ps_rate_monitor.jpg|600px ]] | ||
Revision as of 10:43, 12 March 2015
- The online rate monitor allows one to display PSC and PS counter rates computed using fadc and CTP scalers.
- The monitor can be started in a stand alone mode, i.e., without running DAQ. Trigger and baseline settings
- are taken from the default PS/PSC configuration files, which are also used for the DAQ.
- The monitor can be started from the hdops account using the following command:
- ps_scaler_start
- On the main GUI screen select scalers update time using Update Timer window and press Start button.
- The coincidence rate between two detector arms for the PS and PSC will be displayed in "CTP rate" plots and
- also printed in "Coincidence rate" windows.
