Planned tests + results
- High Voltage plateau === done
Gas: Ar-CO2 87%-13% gas mixture.
Setup: the signal after the shaper was inverted and fed to a discriminator. The HV was changed and the signals above threshold where counted (normalized to 100s measure time).
The result:
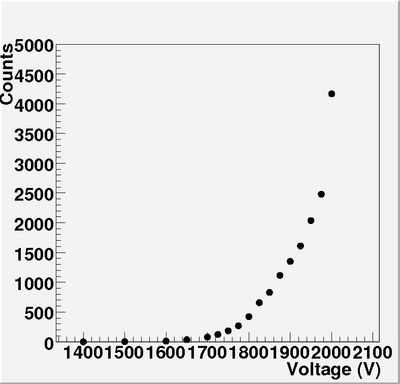
HV-curve,the count is normalized to 100s measurements.
So things start to show up (above threshold, the threshold was set just above noise) at 1700/1750 V and start to break down at 2000V.
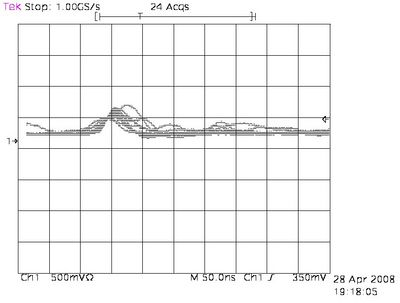
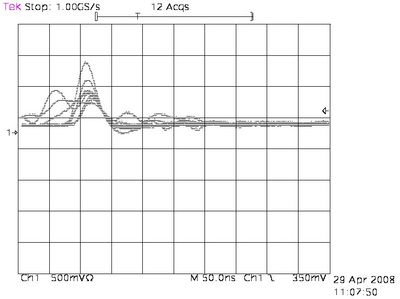
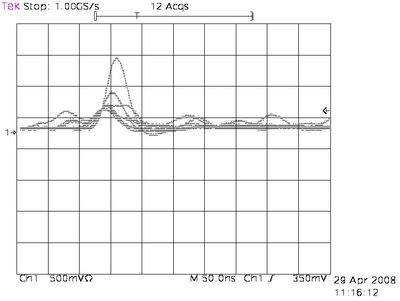
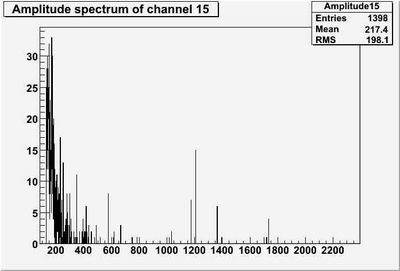
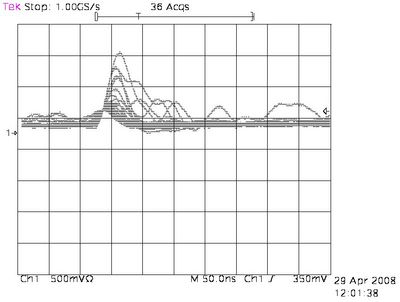
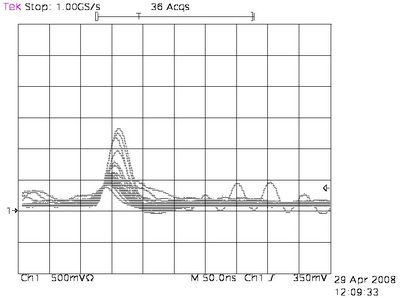
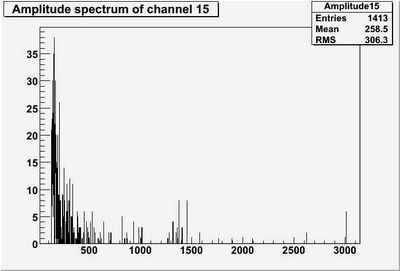
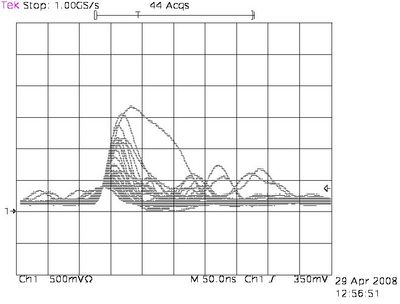
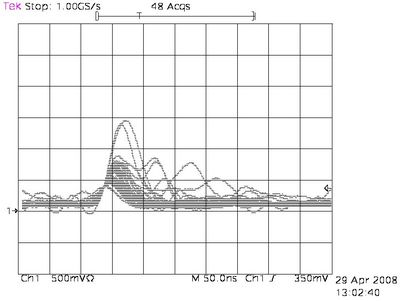
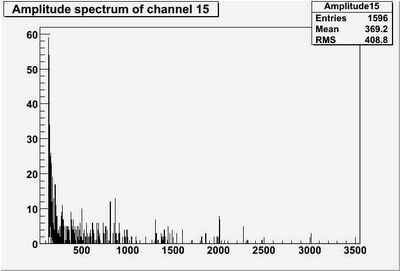
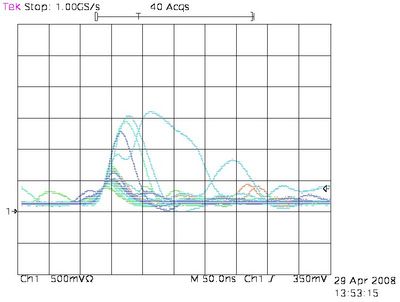
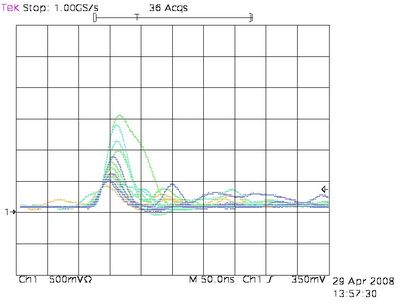
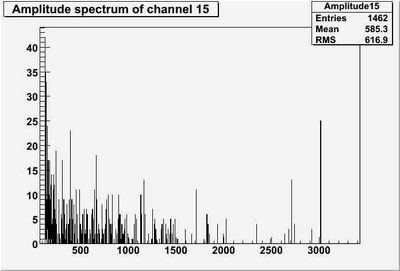
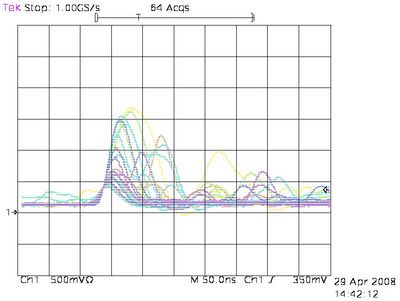
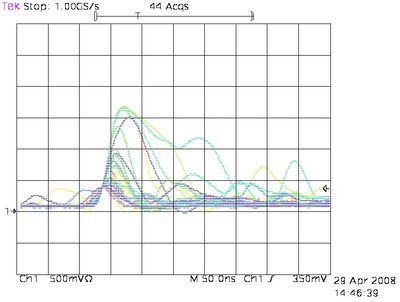
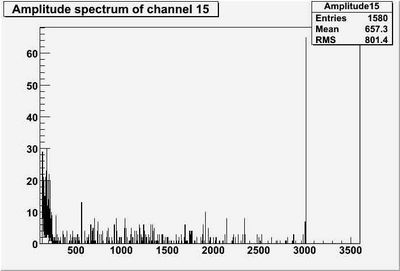
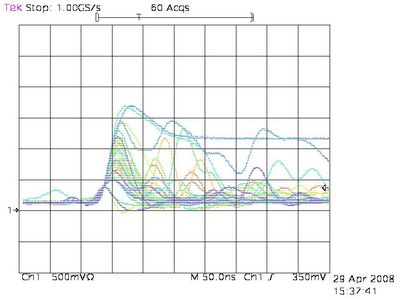
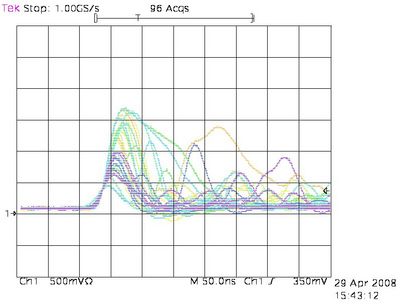
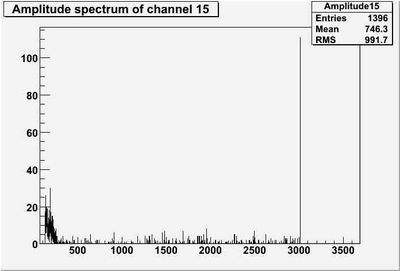
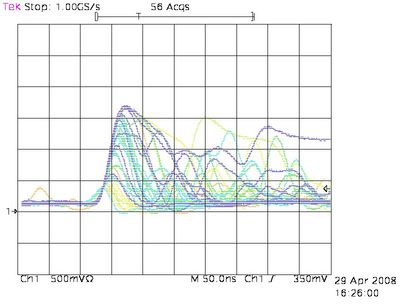
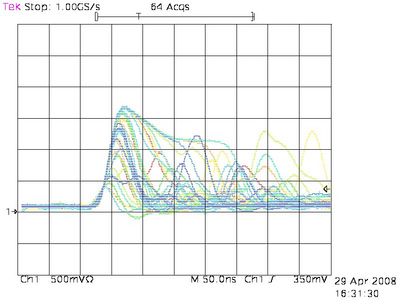
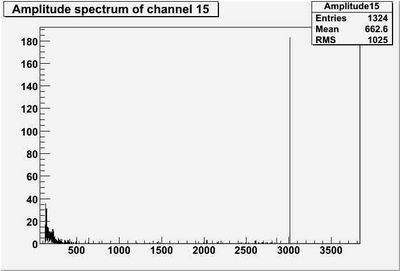
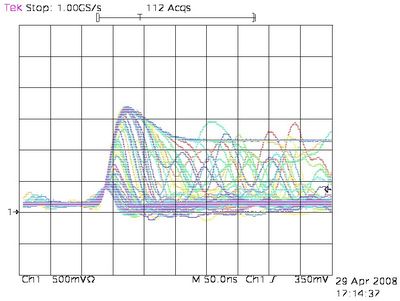
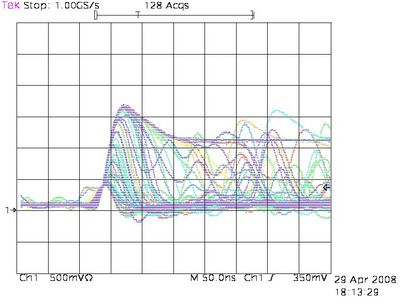
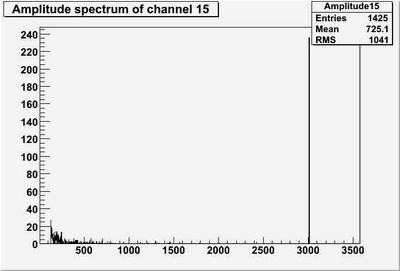
Below galleries of pulses are shown for different HV (on the left channel 2, in the middle channel 15) -- remember everything above 1V is an overflow on the fADC, also the b/w traces are taken with infinite persistence, the colored ones with 10 s persistence. The amplitude spectra are also shown: notice the growing overflow peak around channel 3000 (they are pedestal subtracted):
 Gallery of pulses of channel 2. |
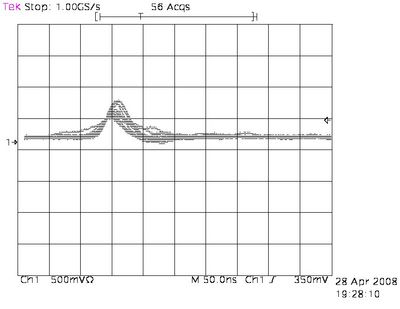 Gallery of pulses of channel 15. |
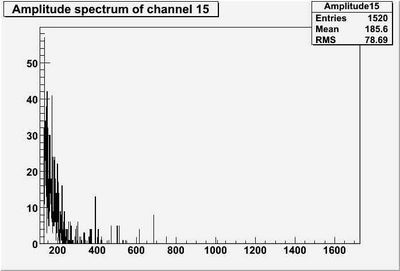 Amplitude spectrum of ch 15 (counts versus amplitude in ADC channels, with shaper). |
 Gallery of pulses of channel 2. |
 Gallery of pulses of channel 15. |
 Amplitude spectrum of ch 15 (counts versus amplitude in ADC channels, with shaper). |
 Gallery of pulses of channel 2. |
 Gallery of pulses of channel 15. |
 Amplitude spectrum of ch 15 (counts versus amplitude in ADC channels, with shaper). |
 Gallery of pulses of channel 2. |
 Gallery of pulses of channel 15. |
 Amplitude spectrum of ch 15 (counts versus amplitude in ADC channels, with shaper). |
 Gallery of pulses of channel 2. |
 Gallery of pulses of channel 15. |
 Amplitude spectrum of ch 15 (counts versus amplitude in ADC channels, with shaper). |
 Gallery of pulses of channel 2. |
 Gallery of pulses of channel 15. |
 Amplitude spectrum of ch 15 (counts versus amplitude in ADC channels, with shaper). |
 Gallery of pulses of channel 2. |
 Gallery of pulses of channel 15. |
 Amplitude spectrum of ch 15 (counts versus amplitude in ADC channels, with shaper). |
 Gallery of pulses of channel 2. |
 Gallery of pulses of channel 15. |
 Amplitude spectrum of ch 15 (counts versus amplitude in ADC channels, with shaper). |
 Gallery of pulses of channel 2. |
 Gallery of pulses of channel 15. |
 Amplitude spectrum of ch 15 (counts versus amplitude in ADC channels, with shaper). |
- (absolute) Gas gain as a function of High Voltage
Source measurement using Sr-90 (e-) or 55-Fe (X-rays) (if we have it) / or using cosmic rays?
-- Estimated time: 1 day -- if we have a good source
- Dynamic range + amplitude distributions
1 week measure with horizontal chamber + 1 week measure with tilted chamber.
For amplitude distributions we need to have modified shapers.
-- Estimated time: 2 weeks
- Collection of gallery of pulses
I found 4 pulse galleries, measured directly after the pre-amplifier made by Gerard when he was here, they are shown below:
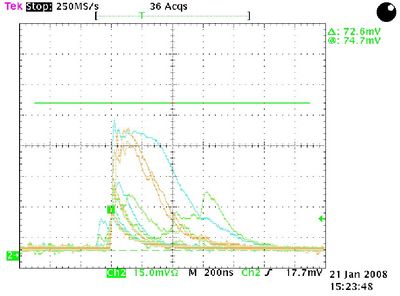
Gallery of pulses measured after the pre-amplifier
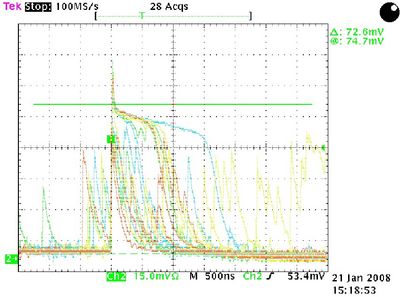
Gallery of pulses measured after the pre-amplifier
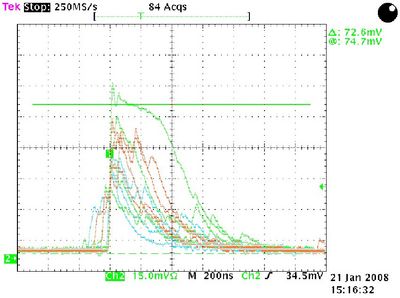
Gallery of pulses measured after the pre-amplifier
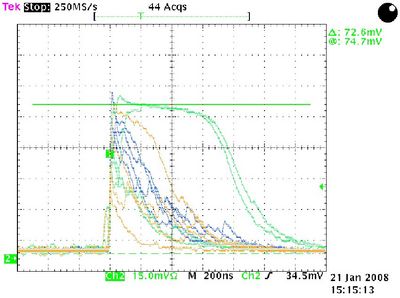
Gallery of pulses measured after the pre-amplifier


