Traces of cosmic rays in coincidence with the scintillators
Here's how the trigger's formed:
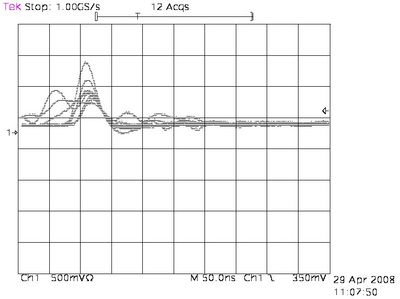
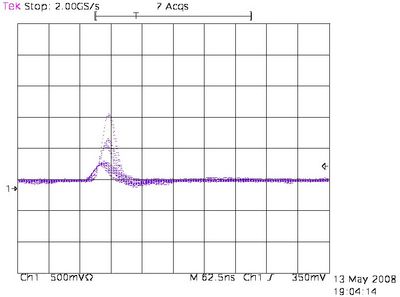
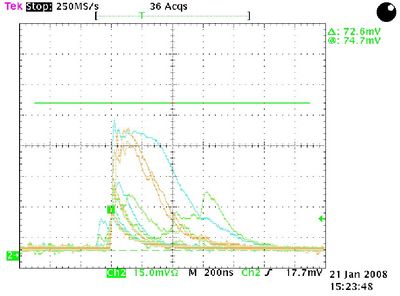
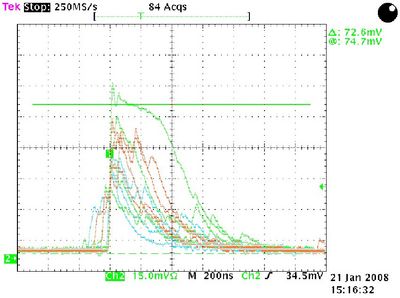
Here are some infinite persistence traces:
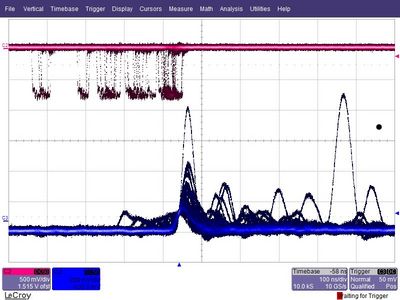 Traces of straight cosmics. |
 Traces of straight cosmics. |
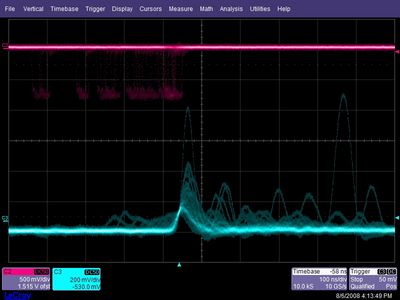
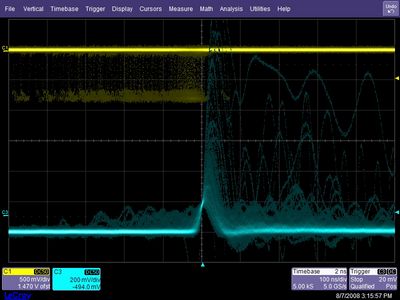
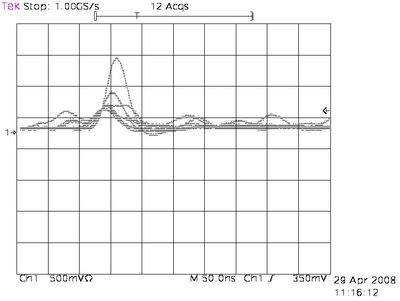
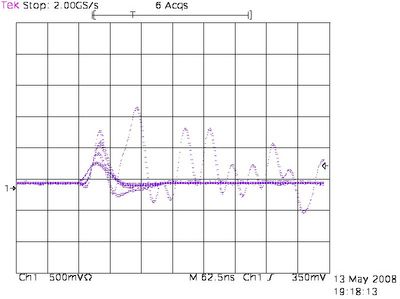
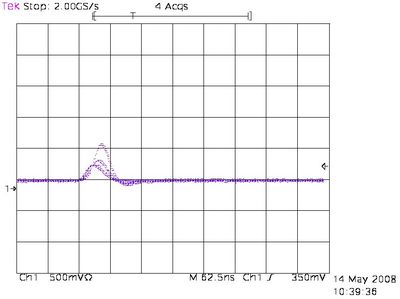
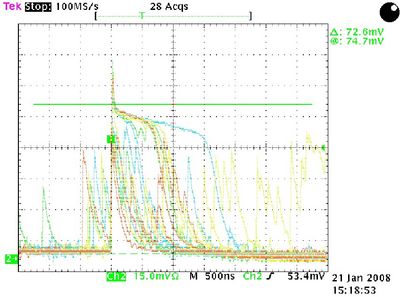
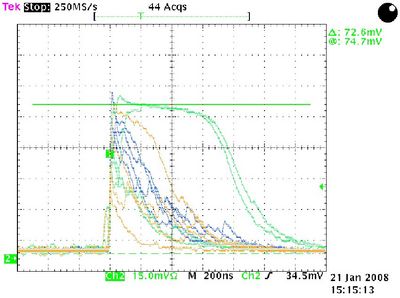
Here are some infinite persistence traces:
 Traces of straight cosmics. |
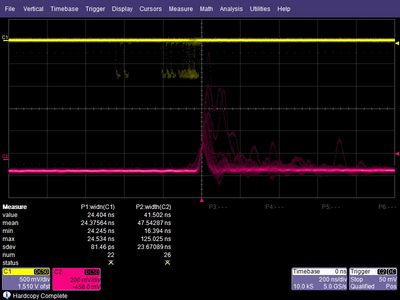 Traces of straight cosmics. |
 Traces of straight cosmics. |
Fe-55 measurements
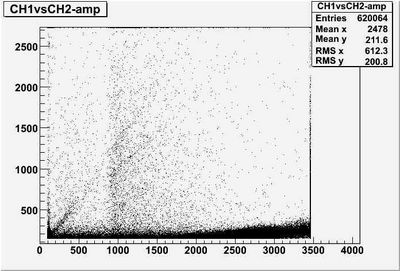
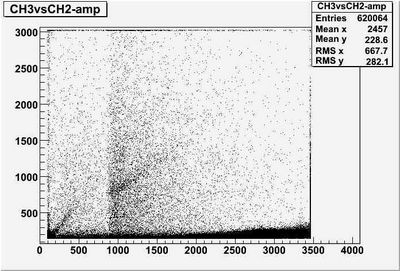
Cross talk
To have a quick look concerning cross talk let's show some scatter plots:
 Fe-55 peak amplitude spectrum (1800 V - begin - upper ). |
|
|
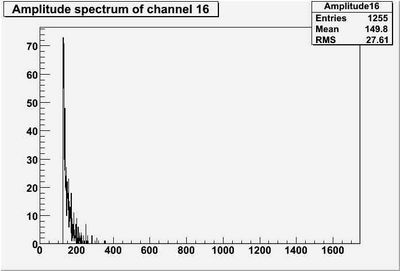
 The electronic channel next to it. |
 The other electronic channel next to it. |
There is some electronic cross talk.
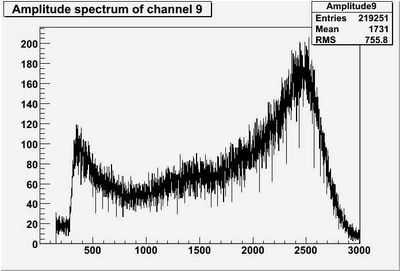
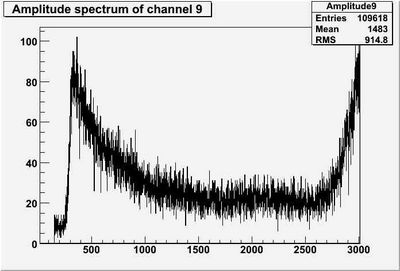
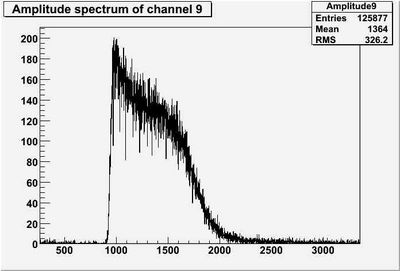
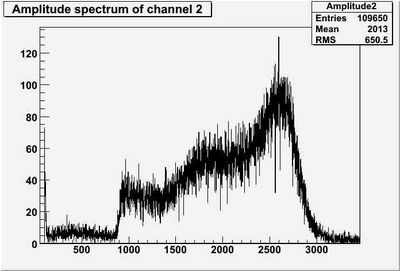
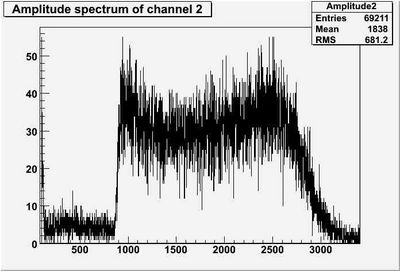
Raw fADC spectra
 Raw fADC spectrum (1800 V - end - upper ). |
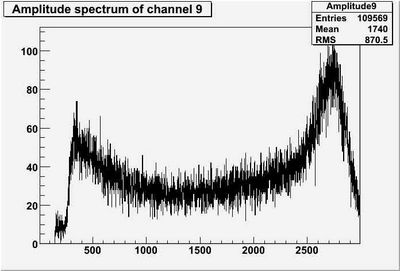
 Raw fADC spectrum (1800 V - end - upper ). |
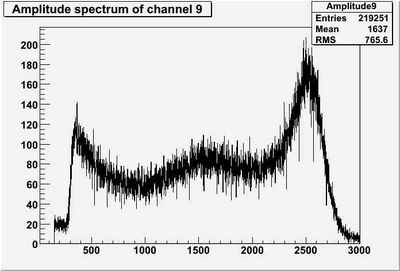
 Raw fADC spectrum (1800 V - end - upper ). |
ADC-channel versus time(ns)
Upper means the straw that does not need extra support.
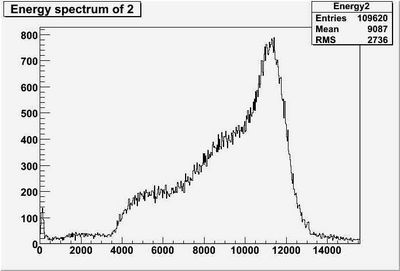
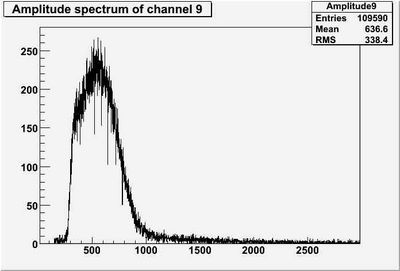
"Energy" spectra
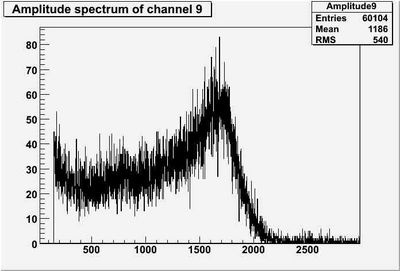
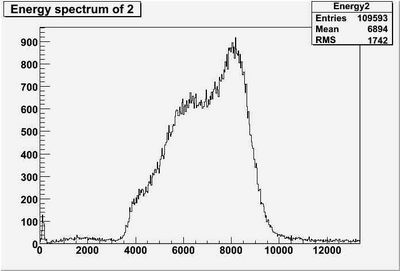 "Energy" spectrum (1750 V - begin - upper ). |
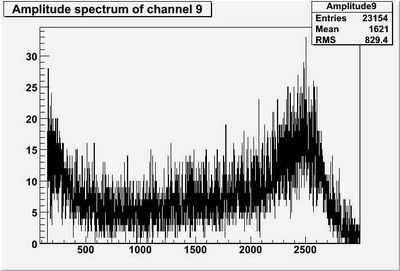
 "Energy" spectrum (1800 V - begin - upper ). |
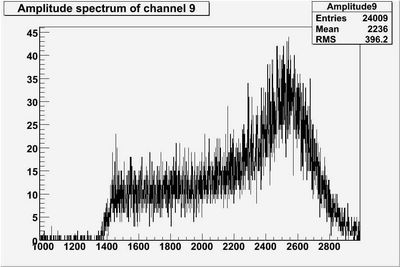
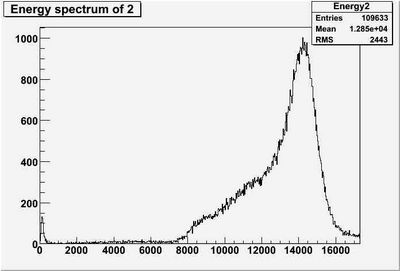 "Energy" spectrum (1850 V - begin - upper ). |
High statistics run:
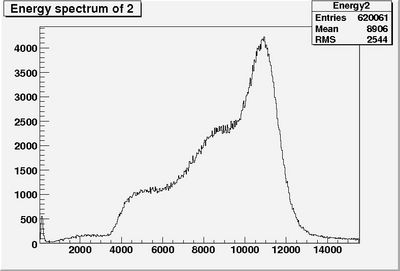 "Energy" spectrum (1800 V - begin - upper ). |
x-axis is in ADC channels
This measurements correspond with the three measurements with different HV on the straw that does not need extra support.
Different HV (Straw supported):
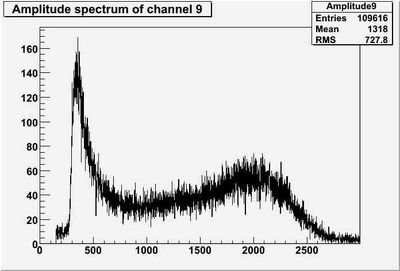
 Amplitude spectrum measured with the 55-Fe source (1750 V - begin). |
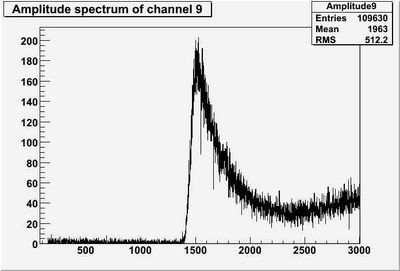
 Amplitude spectrum measured with the 55-Fe source (1800 V - begin). |
Different positions (straw supported,1800V):
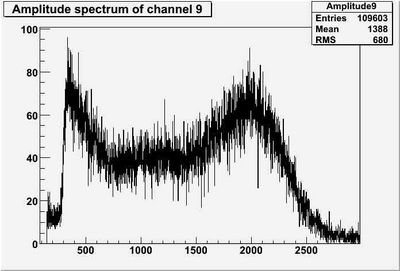
Amplitude spectrum measured with the 55-Fe source (1800 V - begin). |
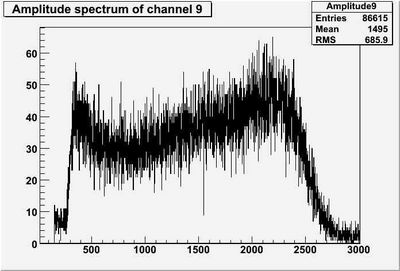
 Amplitude spectrum measured with the 55-Fe source (1800 V - middle). |
 Amplitude spectrum measured with the 55-Fe source (1800 V - end). |
Different HV (Straw not supported)
 Amplitude spectrum measured with the 55-Fe source (1700 V - begin). |
 Amplitude spectrum measured with the 55-Fe source (1800 V - begin). |
 Amplitude spectrum measured with the 55-Fe source (1850 V - begin). |
Are the measurements reproduce-able?
 Amplitude spectrum measured with the 55-Fe source (1800 V - begin - supported). |
supported/not supported (middle) + TILTED (55 degrees)
 Amplitude spectrum measured with the 55-Fe source (1800 V - middle - supported). |
 Amplitude spectrum measured with the 55-Fe source (1800 V - middle - not supported). |
 Amplitude spectrum measured with the 55-Fe source (1800 V - middle - 55 degree tilted). |
What about measuring another straw (one that does not need support - and does not have dead spots):
Different positions (1800V):
 Amplitude spectrum measured with the 55-Fe source (1800 V - begin). |
 Amplitude spectrum measured with the 55-Fe source (1800 V - middle). |
 Amplitude spectrum measured with the 55-Fe source (1800 V - end). |
Reproduce-able?:
 Amplitude spectrum measured with the 55-Fe source (1800 V - begin). |
Different-HV:
 Amplitude spectrum measured with the 55-Fe source (1750 V - begin). |
Amplitude spectrum measured with the 55-Fe source (1800 V - begin). |
 Amplitude spectrum measured with the 55-Fe source (1850 V - begin). |
To finish a high statistics run:
Amplitude spectrum measured with the 55-Fe source (1800 V - begin - high statistics). |
Chamber at 0 degrees
- Measurements with the 55-Fe source
 Amplitude spectrum measured with the 55-Fe source (1750 V - low threshold). |
 Amplitude spectrum measured with the 55-Fe source (1800 V - low threshold). |
 Amplitude spectrum measured with the 55-Fe source (high threshold - 1800 V). |
- High Voltage plateau === done
Gas: Ar-CO2 87%-13% gas mixture.
Setup: the signal after the shaper was inverted and fed to a discriminator. The HV was changed and the signals above threshold where counted (normalized to 100s measure time).
Update: results with 3,4,5 sigma pedestal cuts:
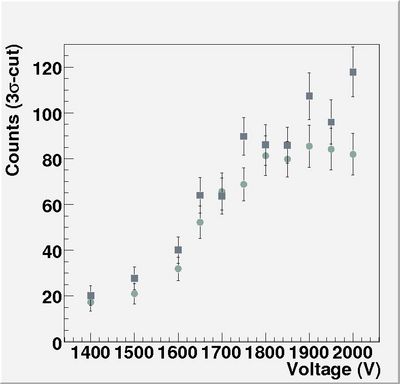 HV-curve - 3sigma cut, tracked events, normalized to a 40' measurements. |
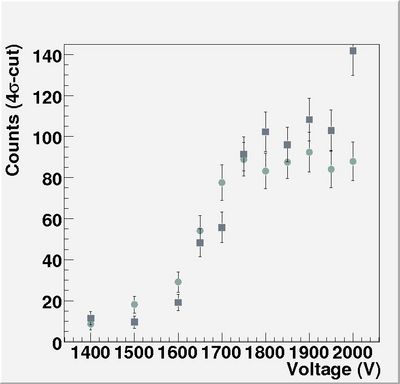 HV-curve - 4sigma cut, tracked events, normalized to a 40' measurement. |
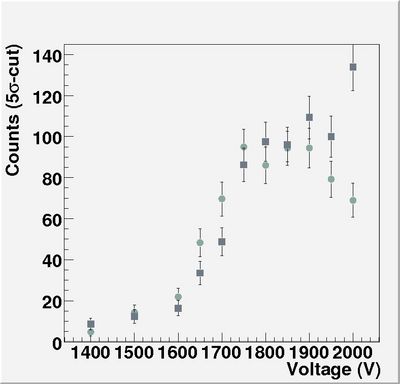 HV-curve - 5sigma cut, tracked events, normalized to a 40' measurement. |
The pedestal means (the error bar is the pedestal width):
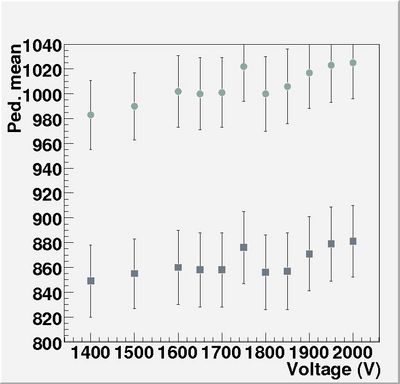 HV-noise-curve - Pedestal mean as a function of applied HV, the error bars represent the pedestal width |
The result:
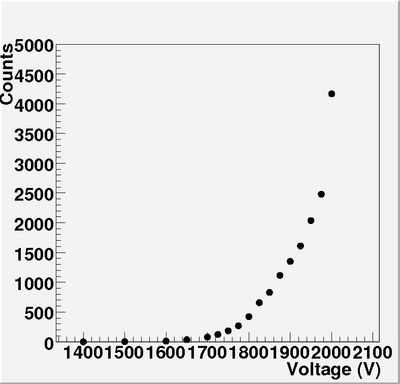 HV-curve,the count is normalized to 100s measurements. |
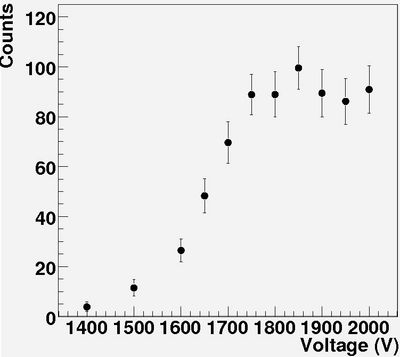 HV-curve-plateau, tracked events, normalized to a 40' measurement. |
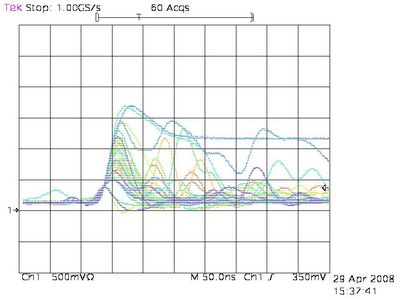
So things start to show up (above threshold, the threshold was set just above noise) at 1500 V and start to break down at +2000V. We see a plateau starting at 1750V. All hv-plateaus are ahown in following figure:
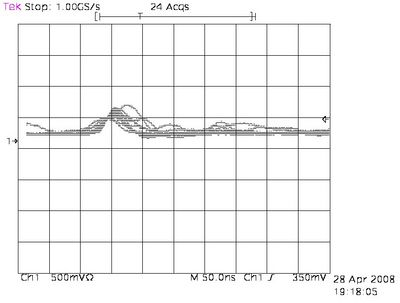
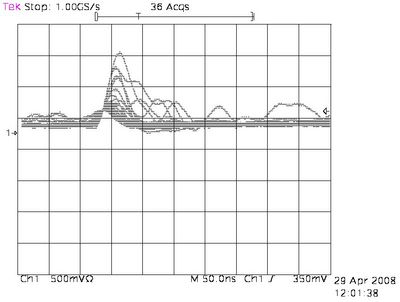
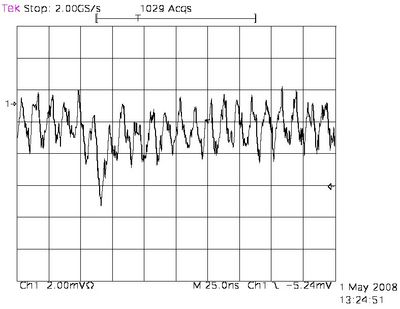
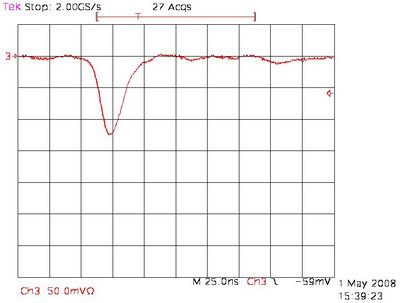
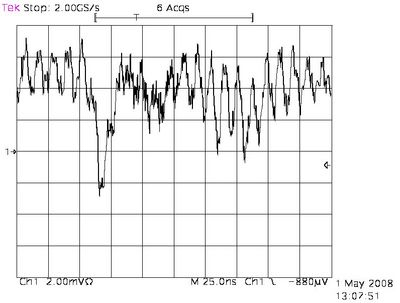
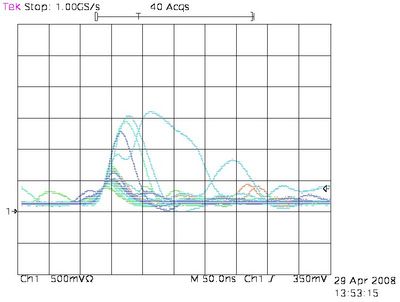
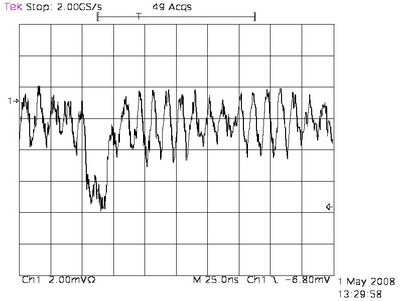
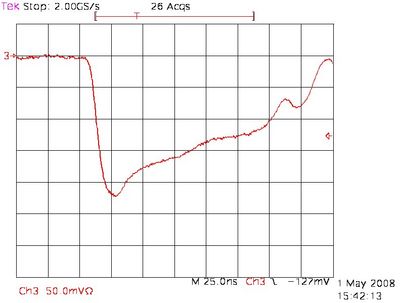
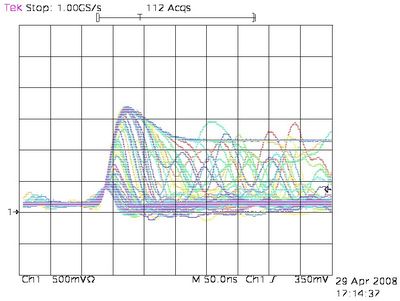
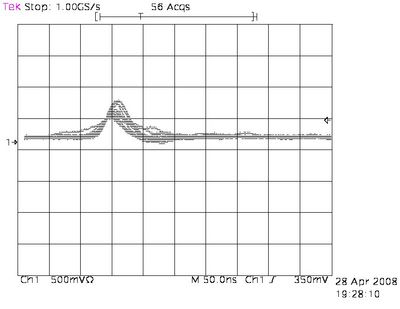
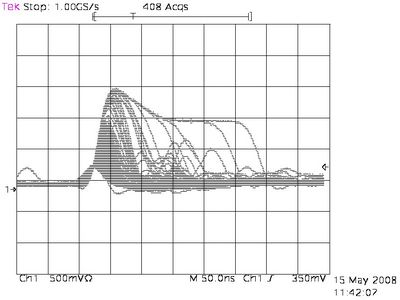
Next the scope traces of the (maximum) noise level after the shaper is shown on the left side. This pickup happens mostly on a different time then a signal. The right side shows a signal at 1800V, also after the shaper. To trigger on the signal I set the threshold to 350 mV.
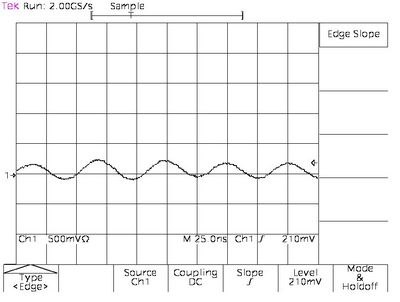 Trace of maximum noise after shaper. |
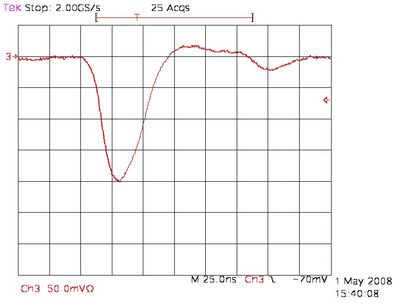
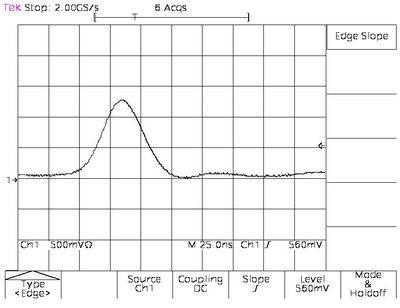 Trace of a signal at 1800 V after the shaper. |
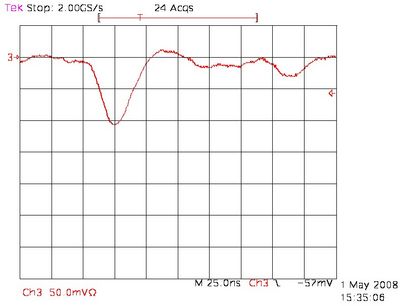
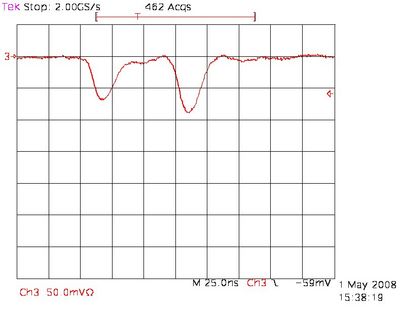
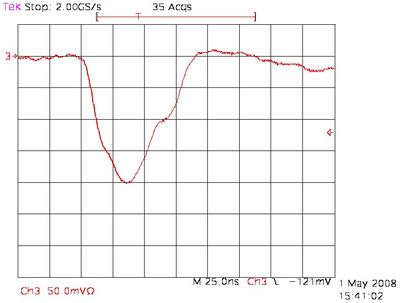
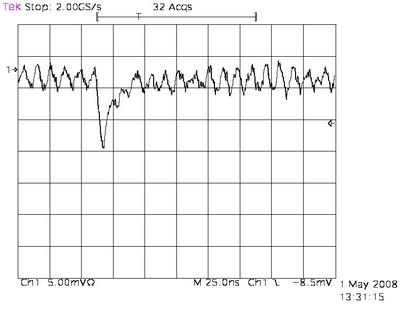
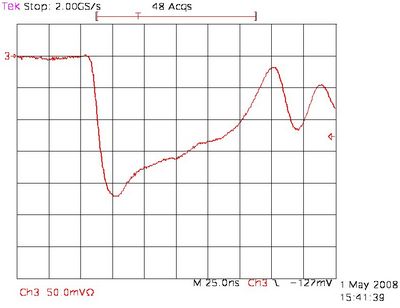
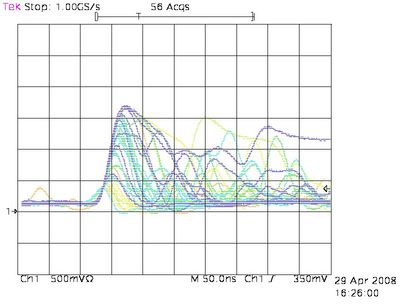
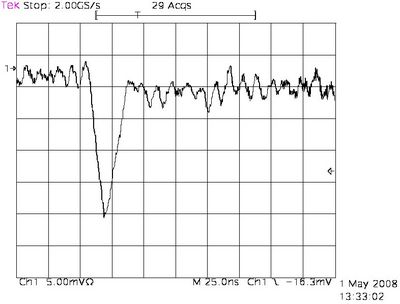
Let's compare signals at different stages in the electronics chain. Left plot is the signal right BEFORE the pre-amplifier, middle plot is the signal AFTER the pre-amplifier (0.366 times attenuated because of the differential probe), right plot is AFTER the shaper.
| Noise before preAmp is dominated by the noise pickup of the probe.
|
|
|
| N/A because of noisy probe.
|
 Trace of signal after preAmp of channel 2. |
 Gallery of pulses of channel 2. |
| N/A because of noisy probe.
|
 Trace of signal after preAmp of channel 2. |
 Gallery of pulses of channel 2. |
 Trace of signal before preAmp of channel 2. |
 Trace of signal after preAmp of channel 2. |
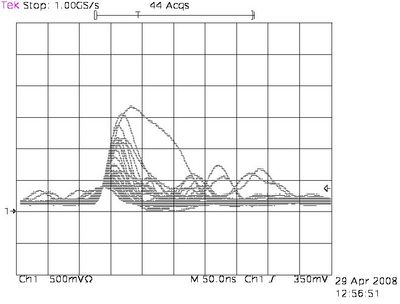 Gallery of pulses of channel 2. |
 Trace of signal before preAmp of channel 2. |
 Trace of signal after preAmp of channel 2. |
 Gallery of pulses of channel 2. |
 Trace of signal before preAmp of channel 2. |
 Trace of signal after preAmp of channel 2. |
 Gallery of pulses of channel 2. |
 Trace of signal before preAmp of channel 2. |
 Trace of signal after preAmp of channel 2. |
 Gallery of pulses of channel 2. |
 Trace of signal before preAmp of channel 2. |
 Trace of signal after preAmp of channel 2. |
 Gallery of pulses of channel 2. |
What exactly does the shaper? Well you can see this in following traces: from left to right: three signals before/after (green/red) the shaper @ 1800 V:
(remember that the signal before the shaper is attenuated (0.336x) )
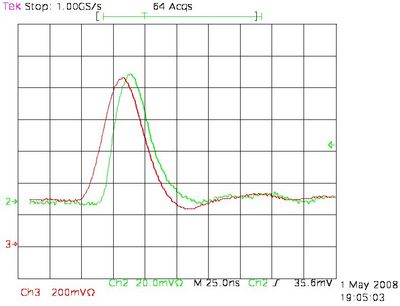 Trace of signal before/after (green/red) shaper. |
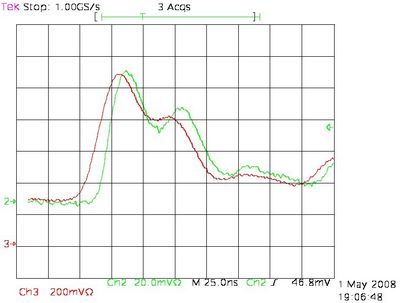 Trace of signal before/after (green/red) shaper. |
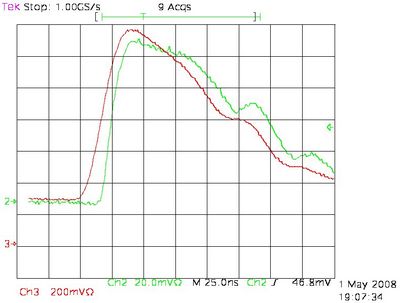 Trace of signal before/after (green/red) shaper. |
The same measurement was performed but now with two probes measuring the differential input signal and MATH function on the scope. Here are three scope traces:
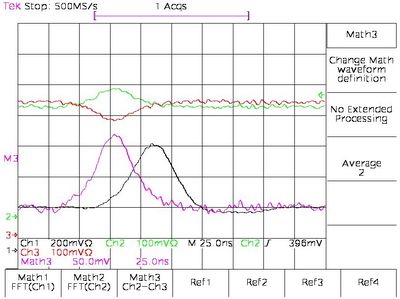 Trace of signal before/after (purple/black) shaper. |
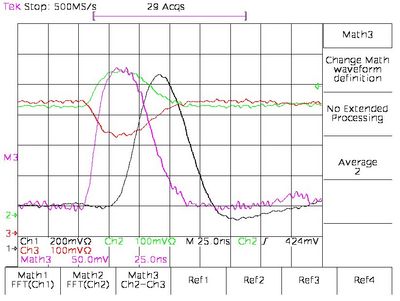 Trace of signal before/after (purple/black) shaper. |
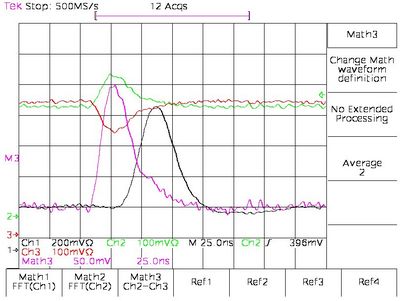 Trace of signal before/after (purple/black) shaper. |
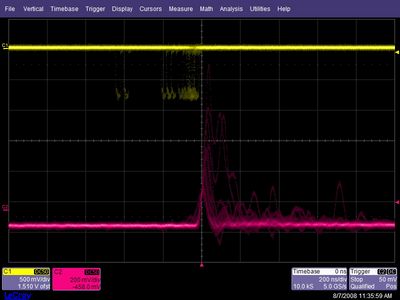
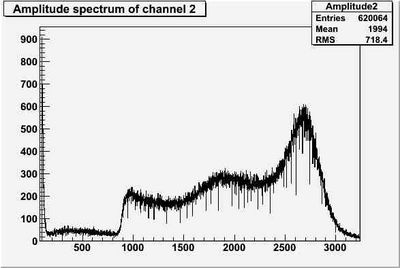
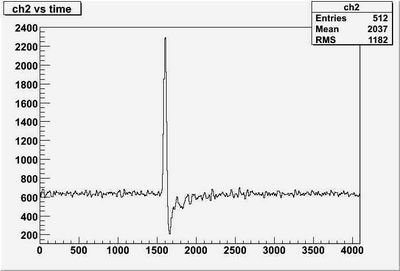
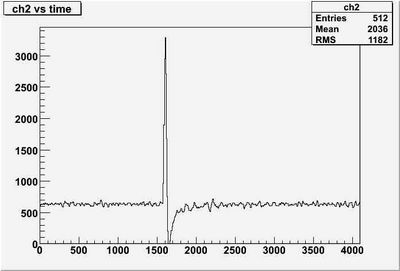
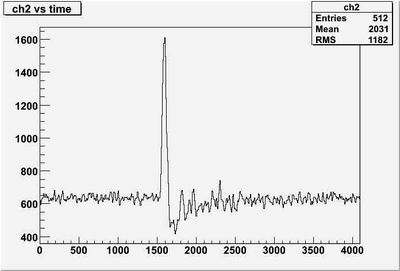
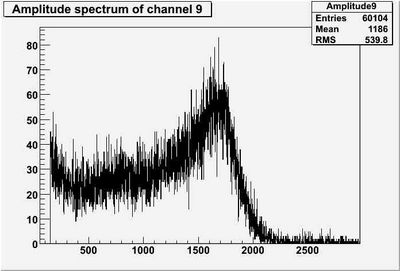
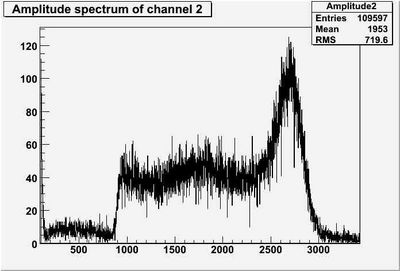
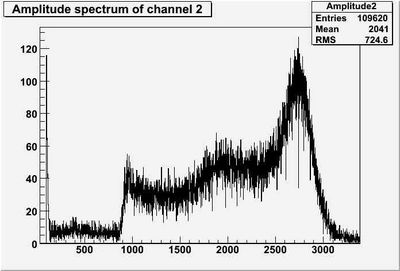
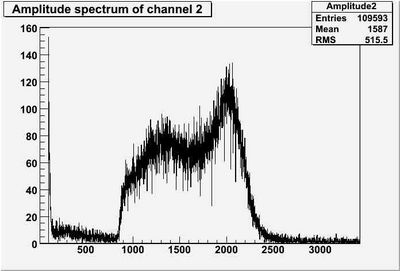
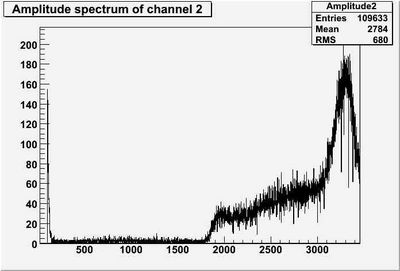
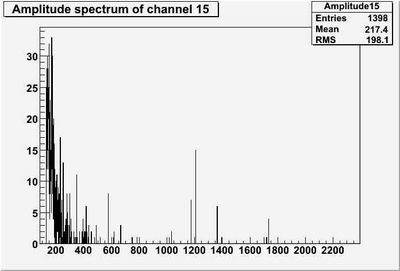
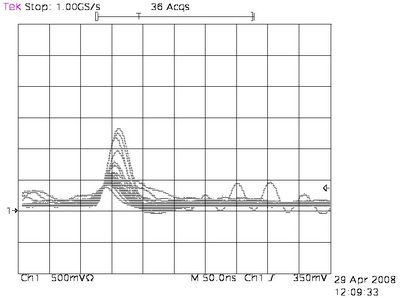
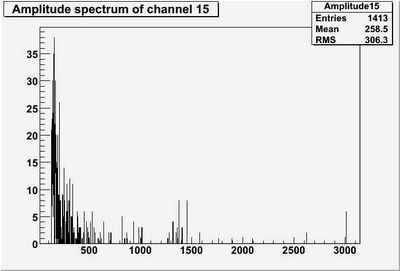
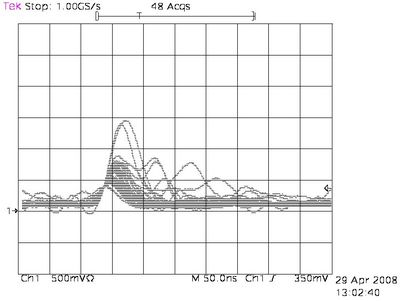
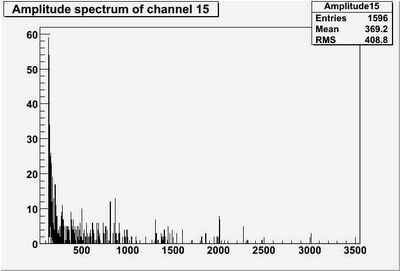
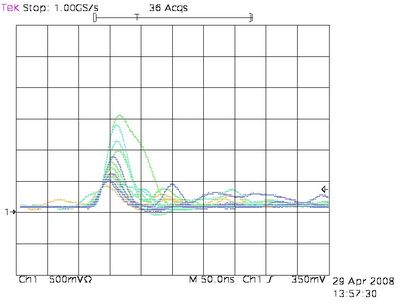
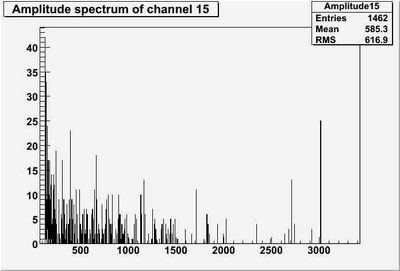
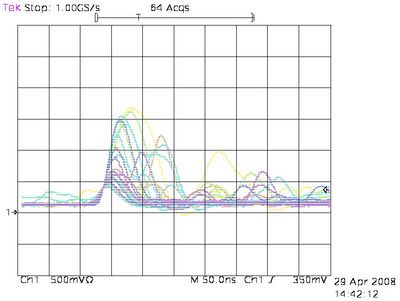
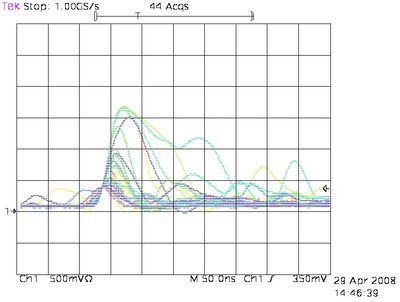
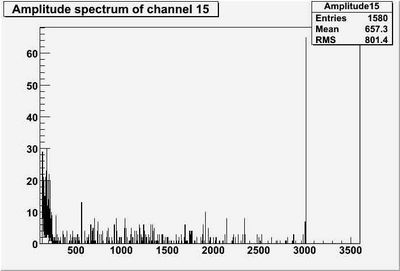
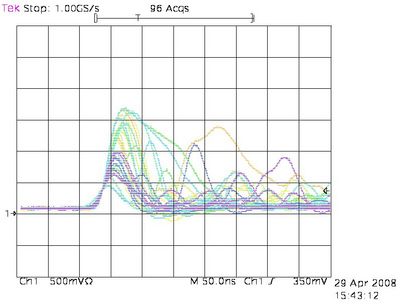
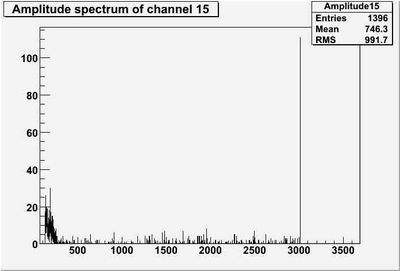
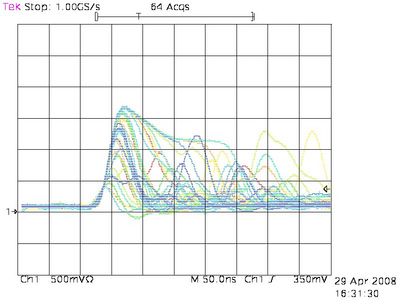
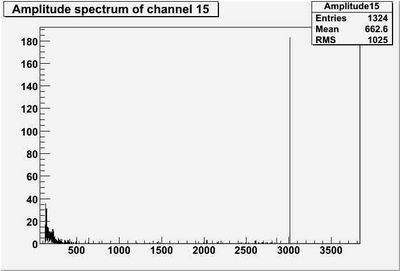
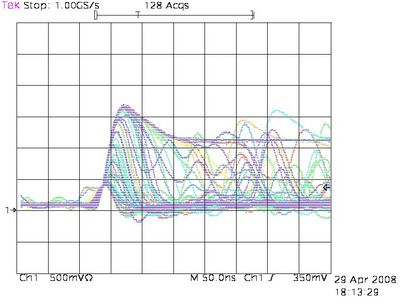
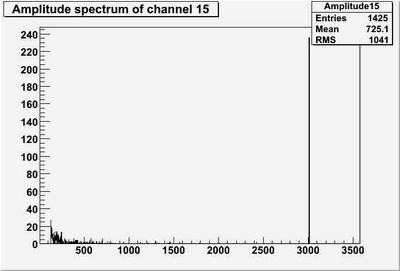
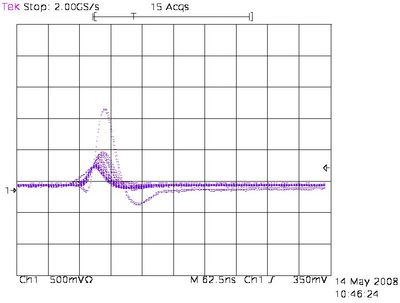
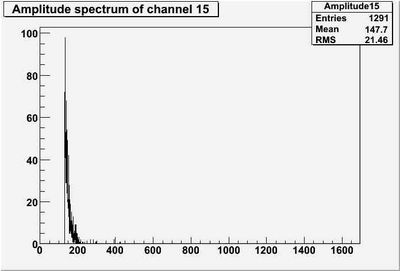
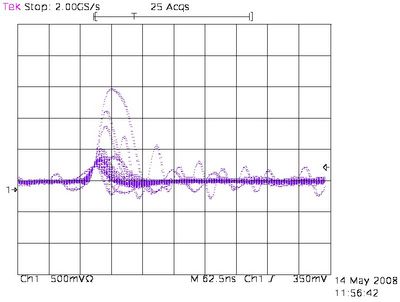
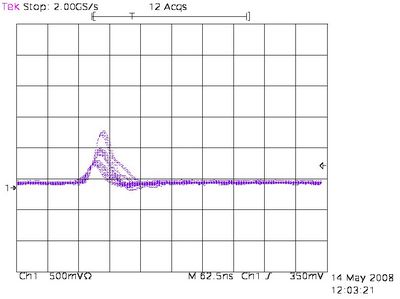
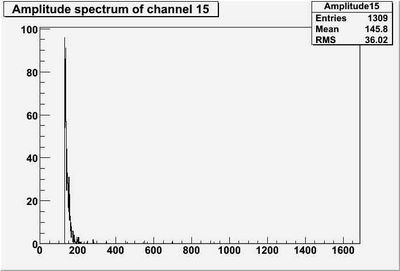
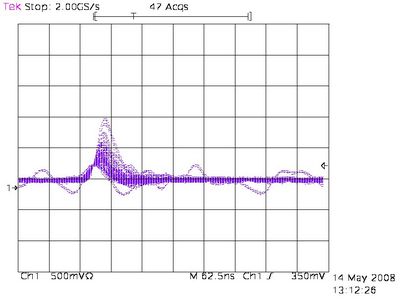
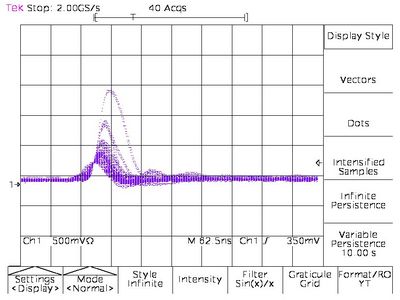
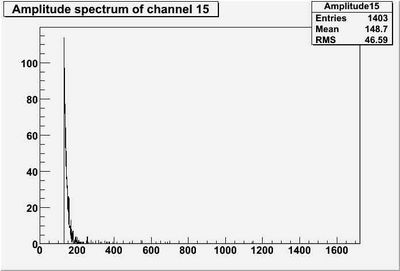
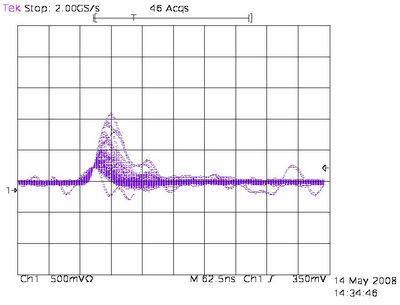
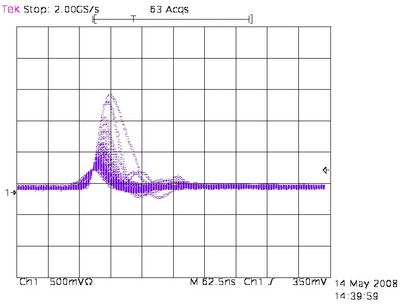
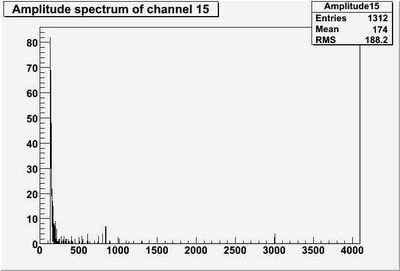
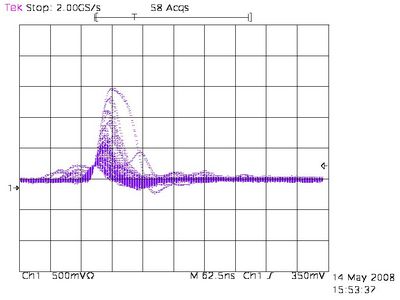
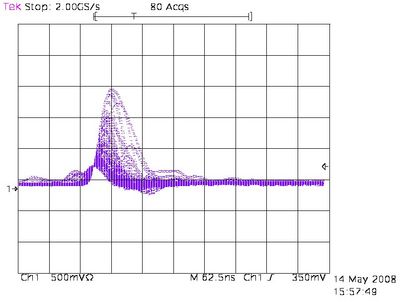
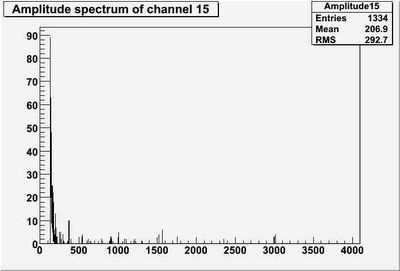
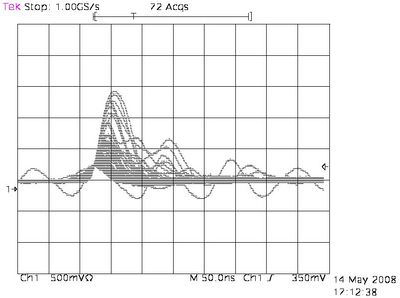
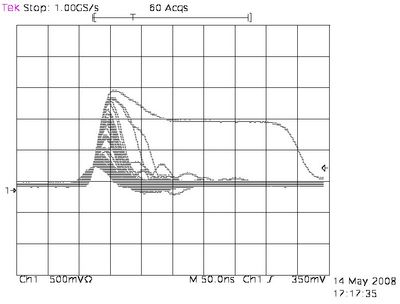
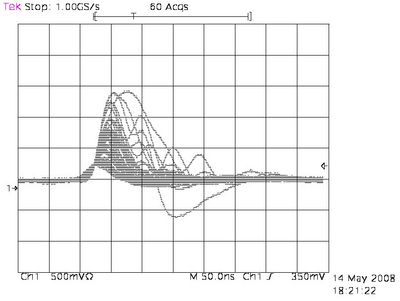
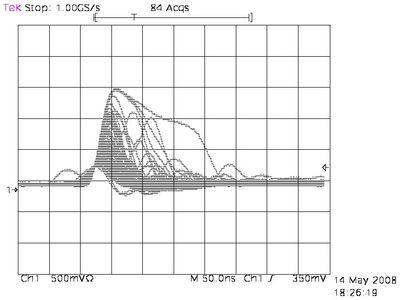
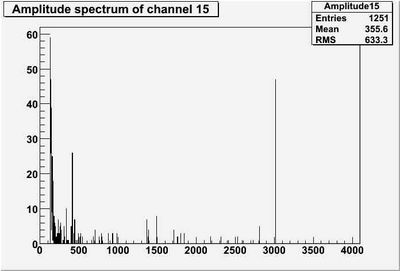
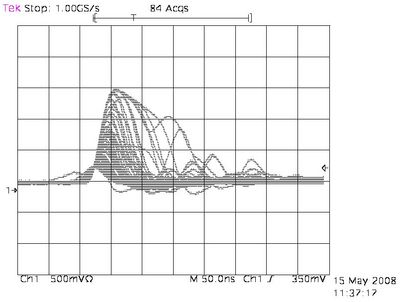
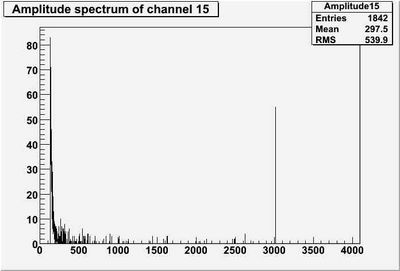
Below galleries of pulses are shown for different HV (on the left channel 2, in the middle channel 15) -- remember everything above 1V is an overflow on the fADC, also the b/w traces are taken with infinite persistence, the colored ones with 10 s persistence. The amplitude spectra are also shown: notice the growing overflow peak around channel 3000 (they are pedestal subtracted):
Gallery of pulses of channel 2. |
 Gallery of pulses of channel 15. |
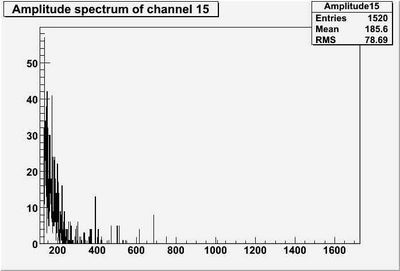 Amplitude spectrum of ch 15 (counts versus amplitude in ADC channels, with shaper). |
 Gallery of pulses of channel 2. |
 Gallery of pulses of channel 15. |
 Amplitude spectrum of ch 15 (counts versus amplitude in ADC channels, with shaper). |
Gallery of pulses of channel 2. |
 Gallery of pulses of channel 15. |
 Amplitude spectrum of ch 15 (counts versus amplitude in ADC channels, with shaper). |
Gallery of pulses of channel 2. |
 Gallery of pulses of channel 15. |
 Amplitude spectrum of ch 15 (counts versus amplitude in ADC channels, with shaper). |
Gallery of pulses of channel 2. |
 Gallery of pulses of channel 15. |
 Amplitude spectrum of ch 15 (counts versus amplitude in ADC channels, with shaper). |
Chamber at 60 degrees
Below you can find some pulse galleries and amplitude spectra (low statistics)
 Gallery of pulses of channel 2. |
 Gallery of pulses of channel 15. |
 Amplitude spectrum of ch 15 (counts versus amplitude in ADC channels, with shaper). |
 Gallery of pulses of channel 2. |
 Gallery of pulses of channel 15. |
 Amplitude spectrum of ch 15 (counts versus amplitude in ADC channels, with shaper). |
 Gallery of pulses of channel 2. |
 Gallery of pulses of channel 15. |
 Amplitude spectrum of ch 15 (counts versus amplitude in ADC channels, with shaper). |
 Gallery of pulses of channel 2. |
 Gallery of pulses of channel 15. |
 Amplitude spectrum of ch 15 (counts versus amplitude in ADC channels, with shaper). |
 Gallery of pulses of channel 2. |
 Gallery of pulses of channel 15. |
 Amplitude spectrum of ch 15 (counts versus amplitude in ADC channels, with shaper). |
 Gallery of pulses of channel 2. |
 Gallery of pulses of channel 15. |
 Amplitude spectrum of ch 15 (counts versus amplitude in ADC channels, with shaper). |
 Gallery of pulses of channel 2. |
 Gallery of pulses of channel 15. |
 Amplitude spectrum of ch 15 (counts versus amplitude in ADC channels, with shaper). |
 Gallery of pulses of channel 2. |
 Gallery of pulses of channel 15. |
 Amplitude spectrum of ch 15 (counts versus amplitude in ADC channels, with shaper). |
 Gallery of pulses of channel 2. |
 Gallery of pulses of channel 15. |
 Amplitude spectrum of ch 15 (counts versus amplitude in ADC channels, with shaper). |
To Do
- (absolute) Gas gain as a function of High Voltage
Source measurement using Sr-90 (e-) or 55-Fe (X-rays) (if we have it) / or using cosmic rays?
-- Estimated time: 1 day -- if we have a good source
- amplitude distributions of tilted chamber
1 week measure with tilted chamber => In progress
- Collection of gallery of pulses
I found 4 pulse galleries, measured directly after the pre-amplifier made by Gerard when he was here, they are shown below:
Gallery of pulses measured after the pre-amplifier
Gallery of pulses measured after the pre-amplifier
Gallery of pulses measured after the pre-amplifier
Gallery of pulses measured after the pre-amplifier


