Difference between revisions of "ASIC design optimizations"
From GlueXWiki
m (→Planned tests) |
m (→Planned tests) |
||
| Line 3: | Line 3: | ||
* High Voltage plateau | * High Voltage plateau | ||
Gas: Ar-CO2 87%-13% gas mixture. | Gas: Ar-CO2 87%-13% gas mixture. | ||
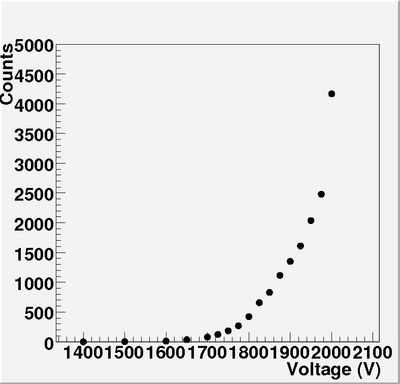
| − | Setup: the signal after the shaper was inverted and fed to a discriminator. The HV was changed and the signals above threshold where counted. | + | Setup: the signal after the shaper was inverted and fed to a discriminator. The HV was changed and the signals above threshold where counted (normalized to 100s measure time). |
The result: | The result: | ||
[[Image:hvplateau_ch15.jpg|thumb|none|400px|HV-curve,the count is normalized to 100s measurements.]] | [[Image:hvplateau_ch15.jpg|thumb|none|400px|HV-curve,the count is normalized to 100s measurements.]] | ||
Revision as of 15:44, 30 April 2008
Planned tests
- High Voltage plateau
Gas: Ar-CO2 87%-13% gas mixture. Setup: the signal after the shaper was inverted and fed to a discriminator. The HV was changed and the signals above threshold where counted (normalized to 100s measure time). The result:
- (absolute) Gas gain as a function of High Voltage
Source measurement using Sr-90 (e-) or 55-Fe (X-rays) (if we have it) / or using cosmic rays? -- Estimated time: 1 day -- if we have a good source
- Dynamic range + amplitude distributions
1 week measure with horizontal chamber + 1 week measure with tilted chamber. For amplitude distributions we need to have modified shapers. -- Estimated time: 2 weeks
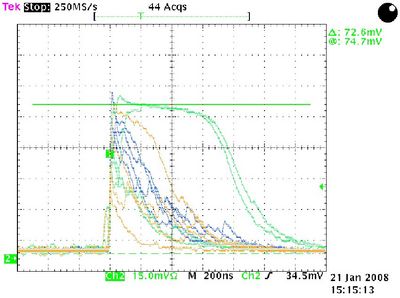
- Collection of gallery of pulses
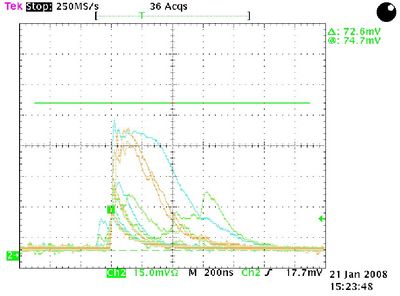
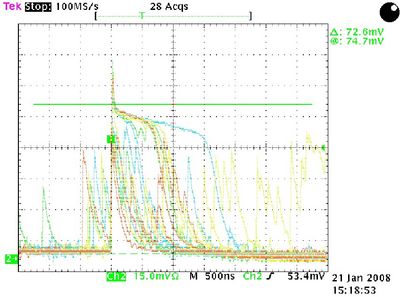
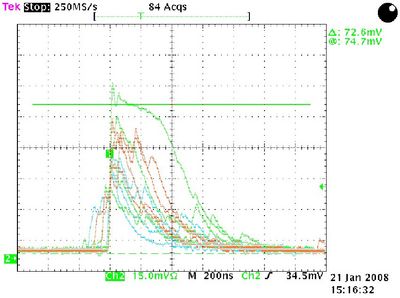
I found 4 pulse galleries, measured directly after the pre-amplifier made by Gerard when he was here, they are shown below:
