Solenoid Mapping Results: May 1, 2013
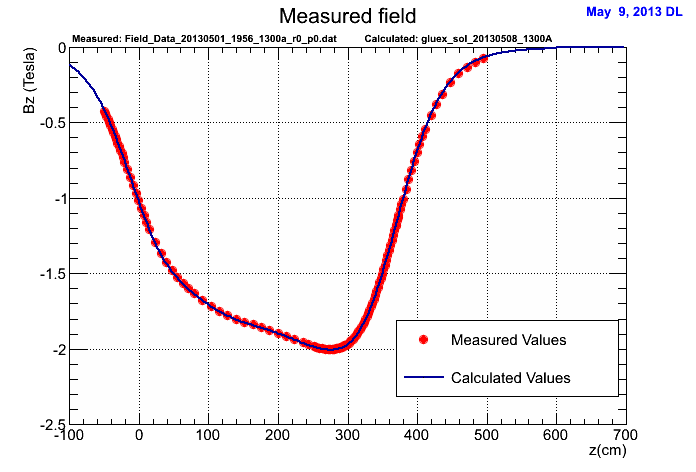
On May 1st, 2013 an effort was made to map the solenoid. One set of points was taken along he z-axis at the center of the magnet (r=0) with 1300A of current. After that, the magnet quenched as it was being ramped up to 1500A do to the full mapping. Below are plots comparing the one data set obtained from mapping to a Poisson calculation of the field at 1300A.
The configuration files used for the Poisson calculation can be found in the subversion repository here:
https://halldsvn.jlab.org/repos/trunk/home/davidl/PoissonConfigFiles
The relevant files are:
gluex_sol_20130508_1300A.am
gluex_sol_20130508_1300A.in7
gluex_sol_20130508_1300A.xlsx
The source code, binaries, and instructions on calculating the field can also be found in the subversion repository here (I used what is in Poisson_OSX):
https://halldsvn.jlab.org/repos/trunk/sim-recon/src/programs/Utilities/bfield_poisson
The data file containing the measured values is:
/group/halld-online/Solenoid_Mapping/Field_Data_20130501_1956_1300a_r0_p0.dat
Below are plots showing a comparison of the measured and calculated fields. Note that due to technical issues with the software, the calculated values correspond to r=1inch from the beam line while the measured values should be at r=0.
Also, there is a z-shift of the measured z-values of -50.60 cm to align it with the lab system used by the calculated values. Initially, this was empirically found to be about -50.25 cm, but then Floyd was able to estimate it using knowledge of the apparatus as described in his e-mail here:
David,

the 50.25 cm (19.783") offset is probably due to our using the upstream edge of the upstream
endplate as our 'zero' (when we calibrated the laser distance), and you used the Hall zero for
your zero.  I was wondering when we would correlate the two.

Nominally the upstream endplate is 50.8 cm. (I will measure it to confirm.)  Also the 3 axis probe
was not initially set for the 'zero', the single axis probe was.  This would account for 2mm offset
from true zero.  Adding these up, I come up with .35 cm difference from the best fit.

When we start mapping again, I will make sure the 3 axis probe (and laser) is 'zero-d' at the magnet
zero and accurately placed at zero to within the required tolerance.

Cheers,

Floyd
Click on a plot to get to a page where you can see previous versions. The original used a z-offset of -50.25 and the current uses -50.60.
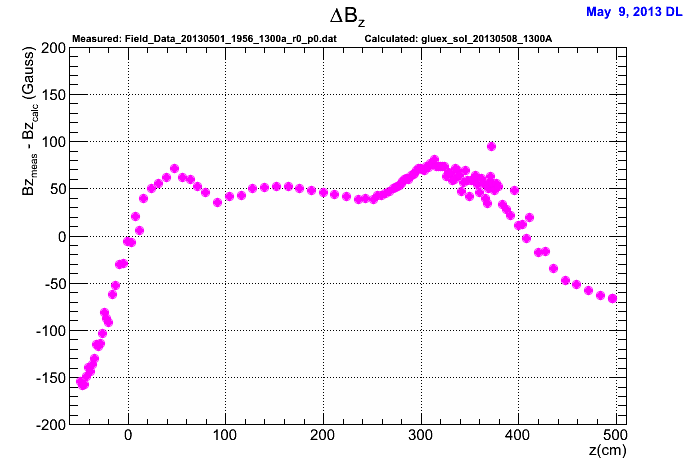
The plot below estimates the difference between the measured and calculated fields. It does this by creating a 3rd order spline from the calculated values and then evaluating the spline at the measured z-values.
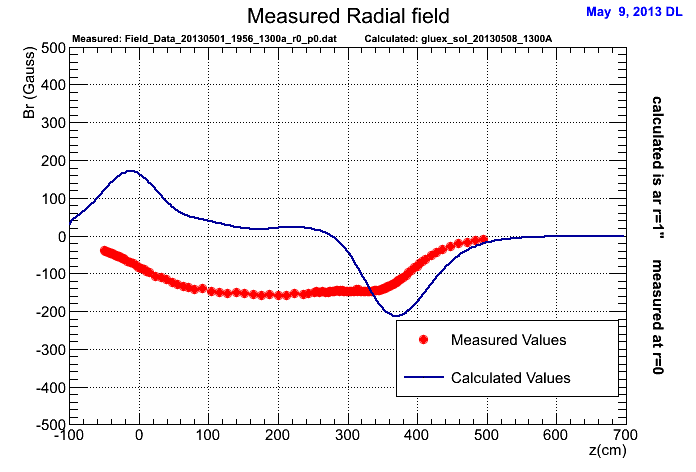
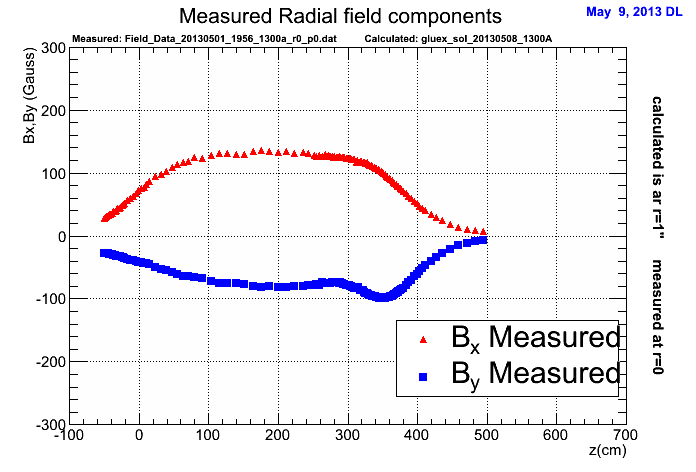
The plot below of the radial component of the field may be a bit misleading. In the ideal case, the radial component will be zero if perfectly on the axis of symmetry. The calculated values though are slightly off that at r=1inch, so the curve shows the expected behavior of having the radial components larger at the edges of the magnet and in opposite directions on the two ends. The measured values should in principle be zero everywhere, but show a 150Gauss offset in the center of the magnet(??)
The plot below shows the X and Y components of the measured field. The Bx values in particular seem to map the Bz values suggesting the probe may have been slightly misaligned causing some of the z-field component to be read as Bx or By.
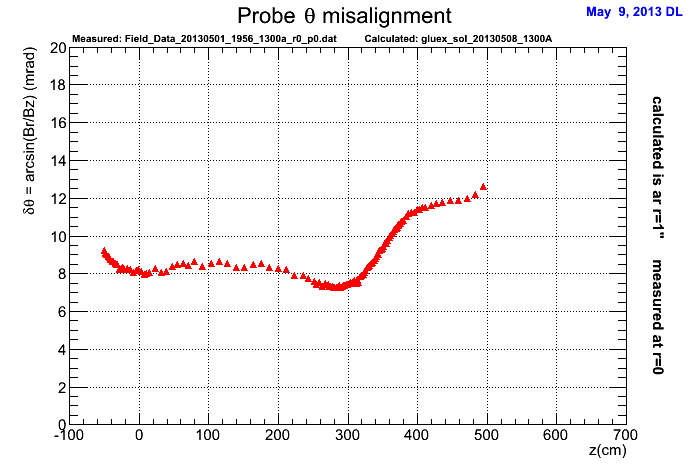
This shows the misalignment of the probe assuming the X and Y components are due solely to a misalignment of the probe by and angle θ w.r.t the z-axis.
