GlueX phase 2, 2023-01 data set
Contents
List of changes
These lists are giving the run ranges where the FCAL hardware was not changed.
Monitoring results
What is currently in the default variation
The default variation contains the latest and most up-to-date tables.
Periods
| Min Run | Max Run | Batch # | Gains |
|---|---|---|---|
| 120297 | 120444 | 1 | [1] |
| 120445 | 120679 | 2 | [2] |
| 120680 | 120790 | 3 | [3] |
| 120791 | 120894 | 4 | [4] |
| 120910 | 121092 | 5 | [5] |
| 121093 | 121207 | 6 | [6] |
Timing
Done for each batches above.
Pedestals
The pedestal calibration is performed for each block & run. When there is no response to LED lights, the block is marked as a potential bad block and is set arbitrarily to a pedestal value corresponding to the average pedestal value for the runs in which this block sees the LED lights.
Map of missing pedestals or blocks integrated over all runs
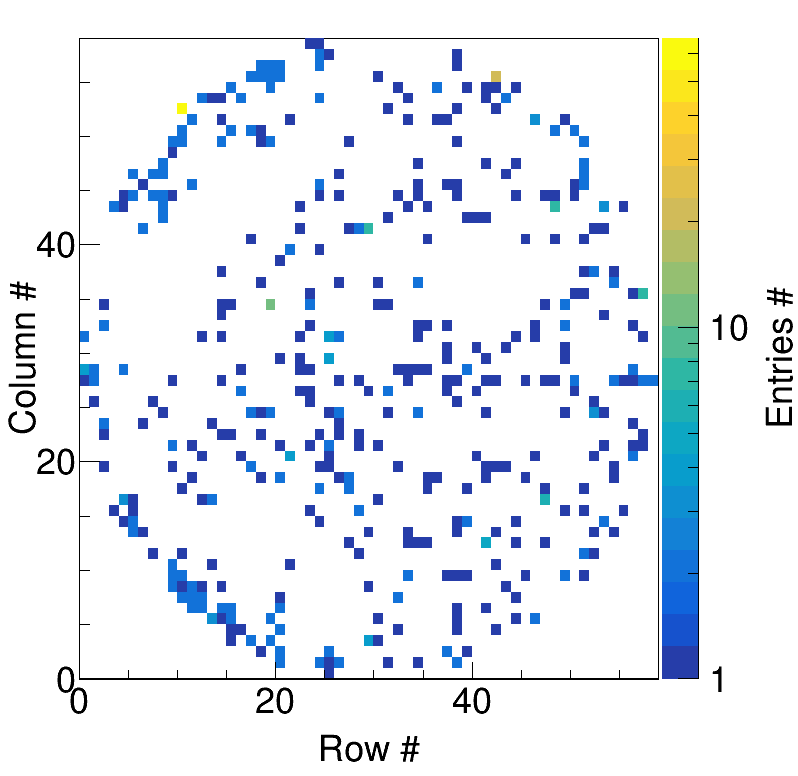
Change of the pedestal value from the nominal pedestal vs block number overall runs
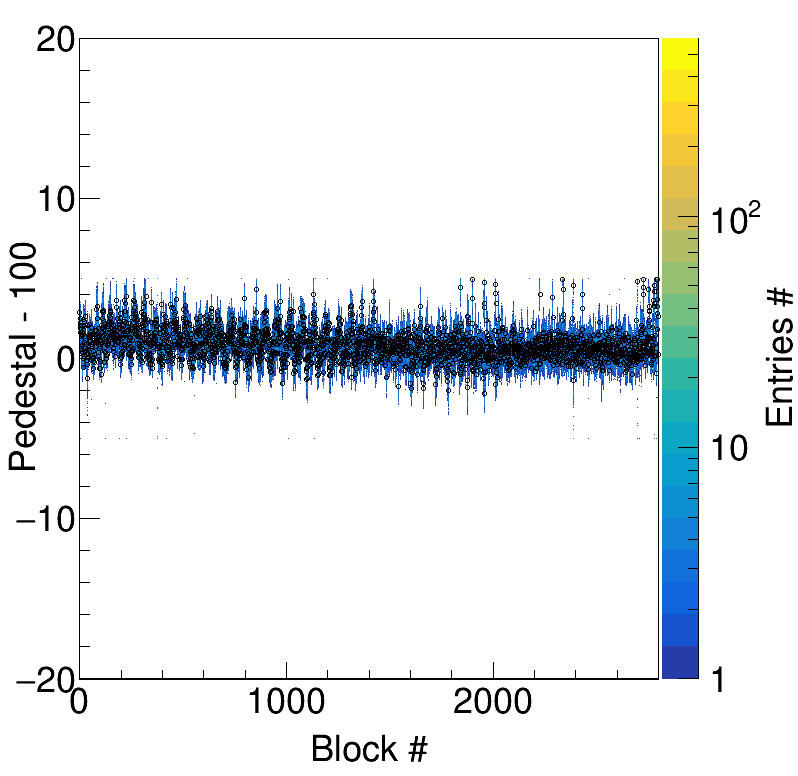
Gain matching calibration plots
The gain matching is using the FCAL pi0 skim. Only ~8% of the data set is skimmed limiting for some batches the calibration accuracy. Nevertheless, the pi0 peak is for each block within 2% of its expected value.
Checking the FCAL gains
Look at the reports and individual diphoton invariant mass.
Energy dependence correction monitoring plots
Bad block map
This map is done for each run number by combining the info collected by analyzing the LED and pi0 skims. This map has to be compared with the block efficiency map. During the simulation smearing, it is either the bad block map or the block efficiency map that has to be used. The bad block map excludes all blocks marked as the central block of a cluster. The block efficiency assigned an efficiency number to this block.
Block efficiency map
Susan will generate the table before June 2024. As this is for simulation purposes there is no urgency.