F125ADC Tests with FDC
In the following data are shown using an f125ADC with the first 24 channels connected to wires the second 24 channels connected to top cathode strips and the last 24 channels to bottom cathode strips.
First we look at the drift time spectrum of the wires. As an example we take wire 17 where the first plot is without interpolation and the
second plot is with interpolation to determine when the signal passes the threshold. Note also that the end of the drift cell is around 230. The
gas mixture used is 90%/10% (Ar/CO2) which leads to a maximum drift time of about 100ns. The basic idea of the interpolation can be found here.
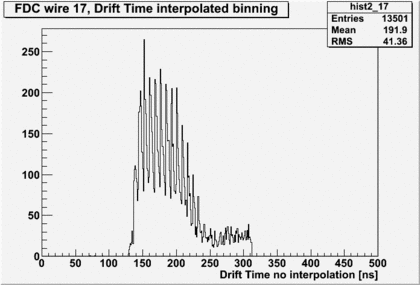
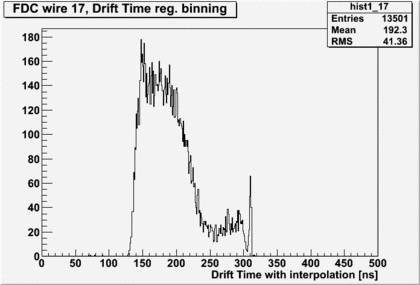
Note in the above plot without the interpolation the peaking structure. The peaks are separated by 8ns the 125MHz clock of the fADC. Using only a linear approach of the samples to determine the time above threshold is clearly not sufficient. To get a better timing determination the interpolation is mandatory.
We can calculate the time difference between this wire and all the strips. This is shown in the following plotting the strip number against the time difference between wire 17 and the strips. The second plot a projection of strip 1 to 7 onto the x-axis to fit the time difference. Note that for each event only the fastest strip in each preamplifier was plotted.
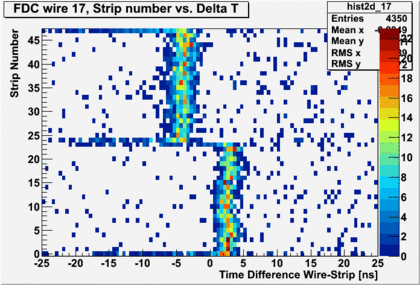
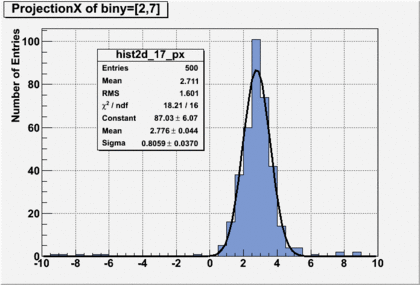
The strips 0 to 23 are the top cathode strips serviced by one preamp card and the strips 24 to 47 are the bottom strips serviced by a second preamp card. The timing resolution is at best 0.8ns in the difference. This means the single channel resolution is better however for the strips it depends strongly on the amplitude as will be shown below.
Note that this plot was done by asking for the fasted strip signal in time. If all strips signals would be plotted a large tail to positive times would be visible. This is due to the time walk. To demonstrate this we plot for a given strip all time differences with the wires depending on the signal amplitude as shown in the following plot:
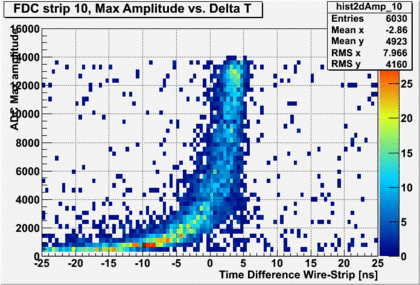
For small strip signal amplitudes the time walk can be substantial.
Some noise that is common to all channels of a given preamp card can be subtracted as well to illustrate this the noise of the signals from the 3 preamp cards is shown in the following plot separated for the 3 preamp cards. It is most prominent for the wire signals because there the gain of the preamp card is a factor of 4.5 smaller. The units of the horizontal axis is in steps of 8ns (125MHz flash ADC).
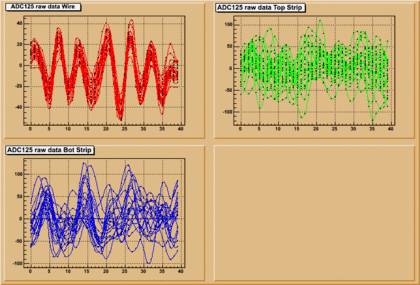
From this plot you can see that a common noise subtraction will have a large impact on the wire data but not on the strip signals. The effect is the most clearly seen when looking at the pedestal summed over many events and compare the width with no common mode subtraction. This is shown in the following plot for strip 10:
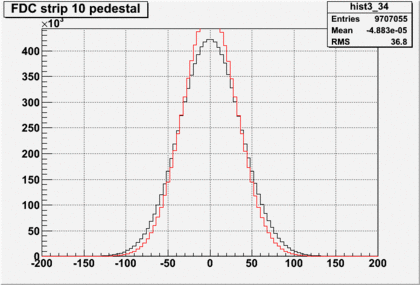
As already expected the effect is not so dramatic because the white noise is dominating. The horizontal axis is in units of ADC channels.