BCAL Threshold Calculation
Contents
Introduction
This page describes the method used to calculate the effective thresholds applied to BCAL readout channels. This has come about in the work done by a special task group formed to address the issue of BCAL Readout Segmentation. The main purpose of the task group is to determine the effect that summing multiple SiPM signals will have on the ultimate energy and timing resolutions.
One of the features present in SiPMs is the presence of dark pulses. These are single or multiple pixels, randomly firing in the device, causing electronic signals not related to any light. These can cause nearby pixels to fire (cross talk) and they can cause the pixel itself to fire again at a later time (after pulsing). This total dark hit rate is purely electronic in nature. The result is that by adding multiple SiPMs together, the dark pulses can also add, causing the summed signal to rise above threshold. This happens frequently enough that we will need to raise the threshold to prevent unacceptably large data rates due to reading out too many dark hits.
This leads to the data rate being a limiting factor when setting the threshold(s) for the BCAL. More specifically, the average event size.
Previous Method
It has been assumed for some time (up to now) that a reasonable limitation of BCAL data footprint would be to set the thresholds such that 5% of the BCAL channels would be read out. This threshold was calculated based purely on the dark hit rate for a single SiPM, assuming every SiPM would have a dedicated readout channel (no summing). For the case of summing, the threshold was scaled up by the number of SiPMs being summed.
The total number of SiPMs in the BCAL is: (48 modules)*(2 sides)*[ (6 layers * 4 sectors) + (4 layers * 4 sectors)] = 3840
5% of total number channels: (3840)(5%) = 192 hits/event

Number of summed channels/readout channel inner: 3
Number of summed channels/readout channel outer: 4

Total number of readout channels when summing: (48 modules)*(2 sides)*[ (2 layers * 4 sectors) + (2 layers * 2 sectors)] = 1152
Proposed Method
The current proposal is to fix the average number of digitized values per event coming purely from dark hits. We choose this number to be 240 (described below) though it could be changed if physics motivations warrant a lower threshold or it is shown a higher threshold would not impact the physics results.
Where the 240 digitized values/event comes from
We start with the value from the previous method of 192 hits/event based on a 5% occupancy. This is rounded up to 200 hits/event. (Note that this was interpreted as dark pulse only hits before for the purposes of threshold calculation, but we interpret it as total hits here.)
The most recent event size estimates (GlueX-doc-1043) indicate an average of about 84 hits/event from the BCAL. This is rounded to 80 hits/event. This number did not include any dark hit contribution. It was, however, supposed to represent the number of hits averaged over L1 triggers as applied to backgrounds generated via bggen.
Assuming, therefore, that we will have 80 real hits/event on average, we assume 120 dark hits/event such that 120 + 80 = 200 roughly maintaining the 5% occupancy for the fine-grained readout segmentation.
If we had 2 digitized values per hit, 1 amplitude and 1 time, then the dark pulses would contribute 2 * 120 = 240 digitized values due to dark hits per event (on average).
The total event size based on the 84 hit contribution/event from the BCAL was about 15kB. With 240 more 32-bit values being read out due to the dark pulses, the event size will grow 960 bytes making it closer to 16kB/event.
IMPORTANT: The limit is set in terms of digitized values rather than hits because the inner region of the BCAL will be equipped with both fADC and TDC channels. It is assumed that the fADC will provide both a time and an amplitude while the inner region TDCs will provide an additional time. The end result is that the inner region will have 3 digitized values/hit while the outer region will have only 2 digitized values/hit. Previous event size calculations assumed only 2 digitized values per hit in both the inner and outer regions of the BCAL.
How the threshold is calculated
The calculation is based on there being 2 regions, inner and outer and that they have 3 digitized values/hit and 2 digitized values/hit respectively. Furthermore, it is assumed that the dark hit occupancy of the inner channels will equal that of the outer. One may consider having a fixed energy threshold applied to both regions, but if summing is used, then the outer region will have a disproportionately larger fraction of dark hits as compared to the inner due to summing 4 SiPMs(outer) as opposed to 3 SiPMs (inner).
The fraction of readout channels to be read out due to dark hits per event is calculated via the following:
Ninner/Nchan_inner = Nouter/Nchan_outer

- Ninner is number of inner channel dark hits per event (similarly for Nouter)
- Nchan_inner is total number of readout channels in inner region (similarly for Nchan_outer)

BCAL_AVG_DARK_DIGI_VALS_PER_EVENT = 3*Ninner + 2*Nouter

- BCAL_AVG_DARK_DIGI_VALS_PER_EVENT comes from calibDB and is currently =240
- 3*Ninner is due to 3 digitized values for inner BCAL region
- 2*Nouter is due to 2 digitized values for outer BCAL region

Solving for Nouter...

Nouter = BCAL_AVG_DARK_DIGI_VALS_PER_EVENT/(3*Nchan_inner/Nchan_outer + 2)
For the case of fine segmentation, this results in about 2.4% of the readout channels being read out/event (dark hits only).
For the case of course segmentation, this results in about 7.8% of the readout channels being read out/event (dark hits only).
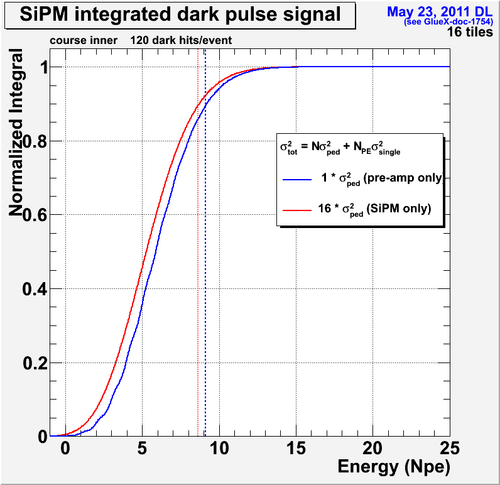
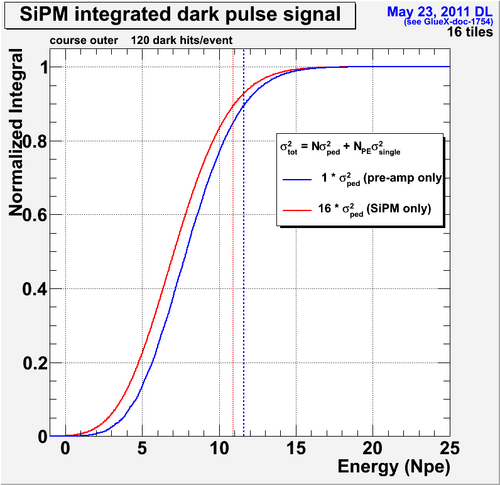
Once the channel fraction is calculated, the amplitude spectrum is calculated based on the convolution of 2 Poisson functions. One based on the average number of dark hits in a 100 ns window: (17.6 MHz * 100ns = 1.76) and the other due to the cross talk and so whose mean is based on the number of initial dark pulses.
The convoluted Poisson's are in the form of a discrete probability distribution function of the number of photoelectrons from 0 to 100. This PDF is then smeared using resolutions obtained from the calibration database. Those values are based on SiPM test data. The smearing leaves a (now continuous) histogram in units of MeV representing the dark pulse only spectrum. This is done for a single SiPM array (4x4 tiles).
In the case of summing, the single SiPM probability distribution is convoluted with itself multiple times to derive the probability distribution from summing independent SiPMs. Finally, this distribution is integrated and normalized to provide a cumulative distribution function for the summed channel. The point where the integral fraction rises above the level set by the event size is where the threshold is set to.
For the numbers given above, this would be the point where the curve goes above 1.0 - 0.024 = 0.976 for the fine grain segmentation (0.922 for the course).
Two plots shown below give an idea of what the cumulative distribution functions look like for the course segmentation in the inner and outer regions. These particular plots were meant to illustrate the difference in the threshold calculation due to assumptions about the pedestal width scaling. As shown in these plots, the threshold is ~9MeV for the inner and ~11MeV for the outer.
IMPORTANT: The 9MeV and 11MeV include an offset due to the average number of dark hits in the event which serves to shift the pedestal. They are also calculated for the old values of 41.6MHz with a 12%PDE and a 15% sampling fraction.
The actual code, including comments that calculates this is given in the CalculateThresholds routine in smear_bcal.cc.
Please direct any questions/comments to: David Lawrence.

