TOF Response
TOF Response
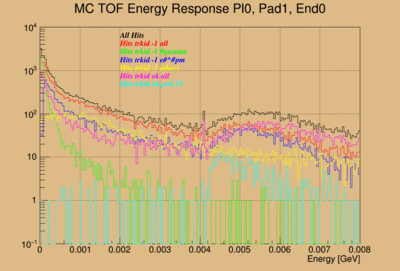
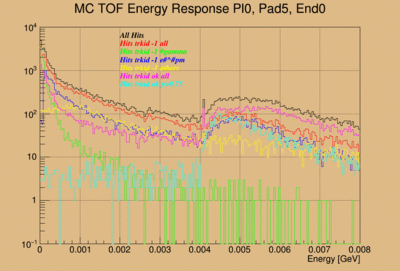
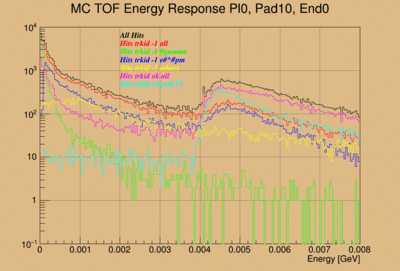
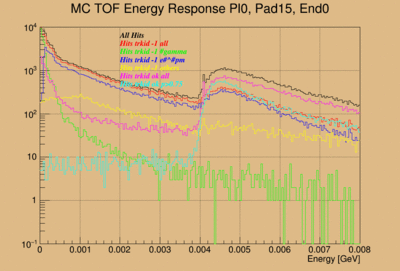
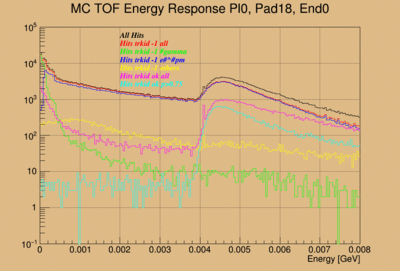
In order to calibrate the TOF energy response it is necessary to compare the data to Monte Carlo (MC) simulations. Only through the comparison with MC data can we find the conversion from ADC integral to Energy in units of GeV or MeV. Because the TOF is close to the forward calorimeter (FCAL) it is necessary to use tracking to define a good sample of minimum ionizing particles with defined impact angle that cause hits in the TOF. This is shown below using MC data for paddle 1, 5, 10, 15 and 18 where paddle 1 is the furthest away from the beam and paddle 18 closest of these five paddles. Only hits are considered that cause a PMT hit on both ends. The black curve represents all such hits. The red curve represents all hits that are caused by particles that were created in the calorimeter volume (not coming from the target!). These hits are further subdivided into gammas (green), leptons(blue) and all others (yellow). The purple histogram are hits caused by particles with a proper track id meaning these particles come from the target or the tracking volume. The light blue histogram are hits caused by particles with proper track id number and with momenta greater than 0.75GeV.
