Difference between revisions of "TOF Response"
(→Issue with some PMT responses) |
|||
| Line 1: | Line 1: | ||
| − | == TOF Response MC DATA == | + | ==TOF Response MC DATA== |
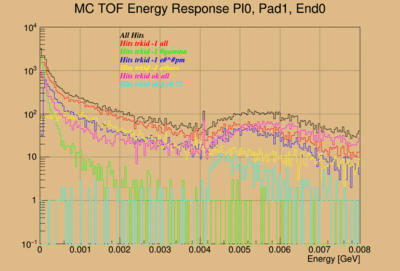
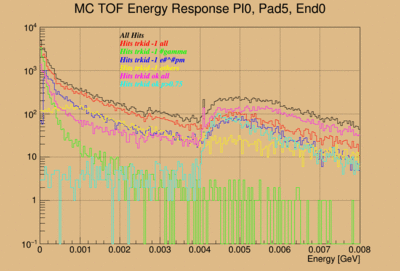
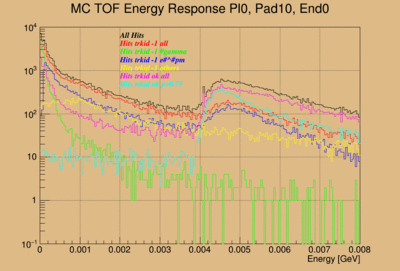
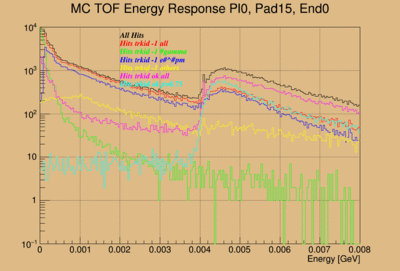
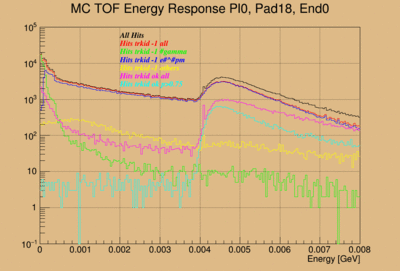
In order to calibrate the TOF energy response it is necessary to compare the data to Monte Carlo (MC) simulations. Only through the comparison with MC data can we find the conversion from ADC integral to Energy in units of GeV or MeV. Because the TOF is close to the forward calorimeter (FCAL) it is necessary to use tracking to define a good sample of minimum ionizing particles with defined impact angle that cause hits in the TOF. This is shown below using MC data for paddle 1, 5, 10, 15 and 18 where paddle 1 is the furthest away from the beam and paddle 18 closest of these five paddles. | In order to calibrate the TOF energy response it is necessary to compare the data to Monte Carlo (MC) simulations. Only through the comparison with MC data can we find the conversion from ADC integral to Energy in units of GeV or MeV. Because the TOF is close to the forward calorimeter (FCAL) it is necessary to use tracking to define a good sample of minimum ionizing particles with defined impact angle that cause hits in the TOF. This is shown below using MC data for paddle 1, 5, 10, 15 and 18 where paddle 1 is the furthest away from the beam and paddle 18 closest of these five paddles. | ||
Only hits are considered that cause a PMT hit on both ends. The black curve represents all such hits. The red curve represents all hits that are caused by particles that were created in the calorimeter volume (not coming from the target!). These hits are further subdivided into gammas (green), leptons(blue) and all others (yellow). The purple histogram are hits caused by particles with a proper track id meaning these particles come from the target or the tracking volume. The light blue histogram are hits caused by particles with proper track id number and with momenta greater than 0.75GeV. | Only hits are considered that cause a PMT hit on both ends. The black curve represents all such hits. The red curve represents all hits that are caused by particles that were created in the calorimeter volume (not coming from the target!). These hits are further subdivided into gammas (green), leptons(blue) and all others (yellow). The purple histogram are hits caused by particles with a proper track id meaning these particles come from the target or the tracking volume. The light blue histogram are hits caused by particles with proper track id number and with momenta greater than 0.75GeV. | ||
| Line 11: | Line 11: | ||
The conclusion to be drawn from these MC data is that in order to do a proper energy calibration of the TOP paddles PMT response it is necessary to use tracked particles with momenta larger than 0.75 GeV that cause a hit in the TOF paddle. From these hits the maximum of the landau distribution can be determined with a fit and a conversion factor from ADC to energy can be determined by comparing real data with MC data. | The conclusion to be drawn from these MC data is that in order to do a proper energy calibration of the TOP paddles PMT response it is necessary to use tracked particles with momenta larger than 0.75 GeV that cause a hit in the TOF paddle. From these hits the maximum of the landau distribution can be determined with a fit and a conversion factor from ADC to energy can be determined by comparing real data with MC data. | ||
| − | == TOF Response Real DATA == | + | ==TOF Response Real DATA== |
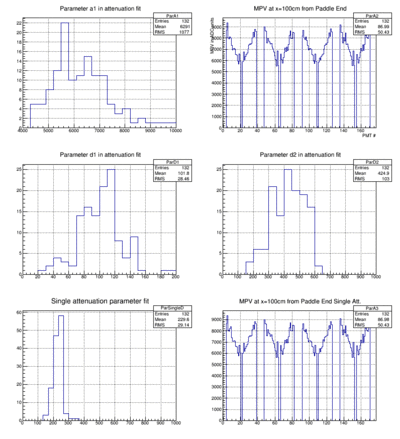
With real data we use tracking to select minimum ionizing partiles with momenta larger than 0.75GeV and looking at the the energy deposition as a function of the distance from the PMT. This data is then fit with using the behavior of attenuation with an exponential function. In particular the data is fit with either a two attenuation length parameter fit or with a single attenuation length parameter fit. The energy deposition as seen by a PMT is then calculated from the fit parameters at a distance of 100cm from the PMT. Both fit procedure give very similar results. As can be seen by the plot below the real data do show a much larger difference variation in the energy response. Much larger than the expected 3% from the MC data for paddles at the center to paddles at the periphery. | With real data we use tracking to select minimum ionizing partiles with momenta larger than 0.75GeV and looking at the the energy deposition as a function of the distance from the PMT. This data is then fit with using the behavior of attenuation with an exponential function. In particular the data is fit with either a two attenuation length parameter fit or with a single attenuation length parameter fit. The energy deposition as seen by a PMT is then calculated from the fit parameters at a distance of 100cm from the PMT. Both fit procedure give very similar results. As can be seen by the plot below the real data do show a much larger difference variation in the energy response. Much larger than the expected 3% from the MC data for paddles at the center to paddles at the periphery. | ||
| Line 18: | Line 18: | ||
The important result is exhibited in the top right (double attenuation lengths) and bottom right (single attenuation length) histograms. In both cases the data show a much larger amplitude for the energy deposit in paddles away from the beam line and much smaller values for paddles close to the beam line. | The important result is exhibited in the top right (double attenuation lengths) and bottom right (single attenuation length) histograms. In both cases the data show a much larger amplitude for the energy deposit in paddles away from the beam line and much smaller values for paddles close to the beam line. | ||
| − | == Issue with some PMT responses == | + | ==Issue with some PMT responses== |
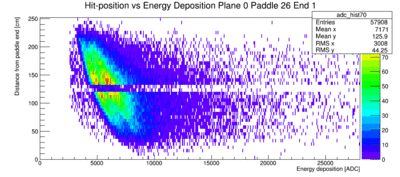
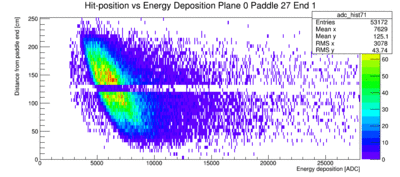
We found some funny behavior with some of the responses of some PMTs. Incidentally the have the same paddle number and end in both planes which means this can not be random. In both planes it is paddle 10, 12, 26, 27 and 34 and only the right/bottom end (end=1). | We found some funny behavior with some of the responses of some PMTs. Incidentally the have the same paddle number and end in both planes which means this can not be random. In both planes it is paddle 10, 12, 26, 27 and 34 and only the right/bottom end (end=1). | ||
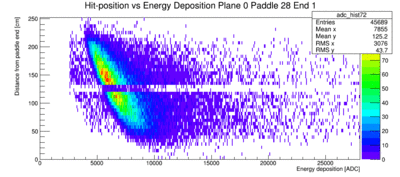
As an example paddle 26, 27 and 28 (for reference how it should look) the PMT response is plotted for different hit positions along the paddle. There is a double peak structure as if two different data sets are in the same plot. But that is not the case, it looks the same for different individual runs. The plots below are from 3 runs together for more statistics. At this point the source of this is not known. A likely culprit may be a bug in the translation table. | As an example paddle 26, 27 and 28 (for reference how it should look) the PMT response is plotted for different hit positions along the paddle. There is a double peak structure as if two different data sets are in the same plot. But that is not the case, it looks the same for different individual runs. The plots below are from 3 runs together for more statistics. At this point the source of this is not known. A likely culprit may be a bug in the translation table. | ||
Revision as of 10:11, 12 October 2015
TOF Response MC DATA
In order to calibrate the TOF energy response it is necessary to compare the data to Monte Carlo (MC) simulations. Only through the comparison with MC data can we find the conversion from ADC integral to Energy in units of GeV or MeV. Because the TOF is close to the forward calorimeter (FCAL) it is necessary to use tracking to define a good sample of minimum ionizing particles with defined impact angle that cause hits in the TOF. This is shown below using MC data for paddle 1, 5, 10, 15 and 18 where paddle 1 is the furthest away from the beam and paddle 18 closest of these five paddles. Only hits are considered that cause a PMT hit on both ends. The black curve represents all such hits. The red curve represents all hits that are caused by particles that were created in the calorimeter volume (not coming from the target!). These hits are further subdivided into gammas (green), leptons(blue) and all others (yellow). The purple histogram are hits caused by particles with a proper track id meaning these particles come from the target or the tracking volume. The light blue histogram are hits caused by particles with proper track id number and with momenta greater than 0.75GeV.
The conclusion to be drawn from these MC data is that in order to do a proper energy calibration of the TOP paddles PMT response it is necessary to use tracked particles with momenta larger than 0.75 GeV that cause a hit in the TOF paddle. From these hits the maximum of the landau distribution can be determined with a fit and a conversion factor from ADC to energy can be determined by comparing real data with MC data.
TOF Response Real DATA
With real data we use tracking to select minimum ionizing partiles with momenta larger than 0.75GeV and looking at the the energy deposition as a function of the distance from the PMT. This data is then fit with using the behavior of attenuation with an exponential function. In particular the data is fit with either a two attenuation length parameter fit or with a single attenuation length parameter fit. The energy deposition as seen by a PMT is then calculated from the fit parameters at a distance of 100cm from the PMT. Both fit procedure give very similar results. As can be seen by the plot below the real data do show a much larger difference variation in the energy response. Much larger than the expected 3% from the MC data for paddles at the center to paddles at the periphery.
The important result is exhibited in the top right (double attenuation lengths) and bottom right (single attenuation length) histograms. In both cases the data show a much larger amplitude for the energy deposit in paddles away from the beam line and much smaller values for paddles close to the beam line.
Issue with some PMT responses
We found some funny behavior with some of the responses of some PMTs. Incidentally the have the same paddle number and end in both planes which means this can not be random. In both planes it is paddle 10, 12, 26, 27 and 34 and only the right/bottom end (end=1). As an example paddle 26, 27 and 28 (for reference how it should look) the PMT response is plotted for different hit positions along the paddle. There is a double peak structure as if two different data sets are in the same plot. But that is not the case, it looks the same for different individual runs. The plots below are from 3 runs together for more statistics. At this point the source of this is not known. A likely culprit may be a bug in the translation table.
