TOF Efficiencies
From GlueXWiki
TOF Efficiencies
- Use the root output file from the plugin TOF_Eff. It contains a root tree with tracks and associated information of the TOF. In particular it has data about the expected TOF paddle hits and actual TOF paddle hits.
- Generate 2d plots of the expected paddle hit (from the extrapolated track) vs. the nearest paddle that actually had a hit. This can be done also by requiring in addition that the paddle in the other plane is a perfect match to the track.The following plot shows such a distribution for particle tracks with momenta between 2.0GeV/c and 2.5GeV/c
The first bin (paddle 0) in the vertical axis means the extrapolated track did not reach the TOF counters.
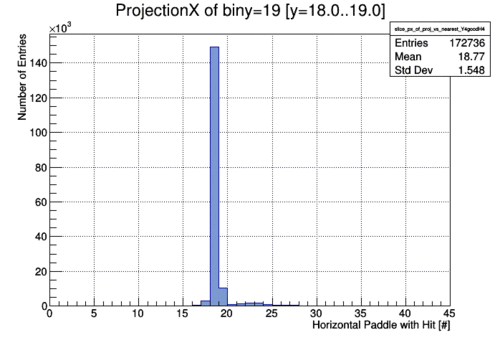
- Projections from this 2d plots to the horizontal axis shows the distributions of TOF paddle hits for an expected hit given by the track. The plot below shows the projection of bin 19 which represents paddle 18

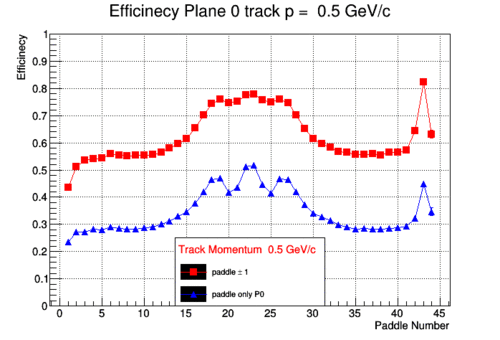
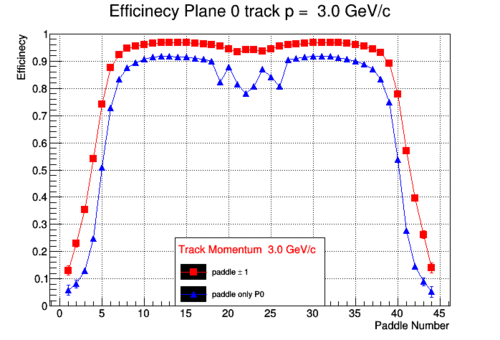
- The Efficiency can then be estimated as the number of hits in the peak divided by the total number of hits in the histogram. One can do this for all runs and see what the distribution over all paddles in a plane looks like for different track momenta.

