Semi-Automatic Field Mapping Logger
From GlueXWiki
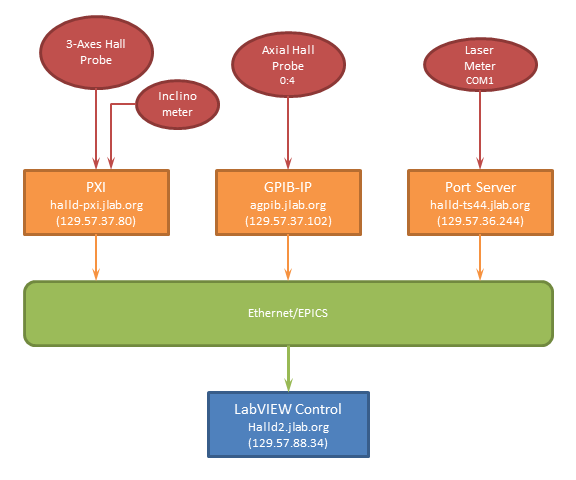
Field Mapping System Diagram
Running the Field Logger Software
1. Use remote desktop to log onto halld2 using account 'JLAB\halldusers', ask Elliott for password
rdesktop halld2 -g 1800x1000
2. Double click the shortcut Field_Logger on the desktop to run the LabVIEW application
- Verify that all readings are updating
- Choose the type of file operation (default: open or create)
- Open or Create a data file
- Type in the radius and phi angle of current probe position
- Load the appropriate Z preset file corresponding to current radius
- Use Previous and Next to choose the starting Z position if needed
- Move and turn the probes to desired Z position with a very small incline angle (both readings should be in green)
- Click Record to record current readings
- Continue to next point
Files
The files are stored on the halld-online group disk here:
/group/halld-online/Solenoid_Mapping
Which should also be accessible from the "M:" drive
M:\halld-online\Solenoid_Mapping
The file names are formatted to contain the date, start time, phi value, and radius. For example, the following file was:
- created on May 1st, 2013 at 11:39am
- the strut was positioned such that the tube positions were along φ=90o
- tube was at R=0 (i.e. along the center of the magnet).
Field_Data_20130501_1139_P90_R12.dat
The columns of a data file are: radius(inch), phi(deg), Z(cm), Incline(deg), B_x(Gauss), B_y(Gauss), B_z(Gauss) and B_axial(Gauss). And the X,Y,Z direction are defined as
- X: points to the beam left
- Y: points vertically up
- Z: points to the beam dump
