Difference between revisions of "Resolutions"
From GlueXWiki
m (→Resolutions) |
m |
||
| Line 116: | Line 116: | ||
|- | |- | ||
|width="415pt"|[[Image:endplate.jpg|thumb|none|400px|Drawing of the end plate of the small prototype.]] | |width="415pt"|[[Image:endplate.jpg|thumb|none|400px|Drawing of the end plate of the small prototype.]] | ||
| + | |- | ||
| + | |} | ||
| + | |||
| + | |||
| + | = GARFIELD - DATA = | ||
| + | |||
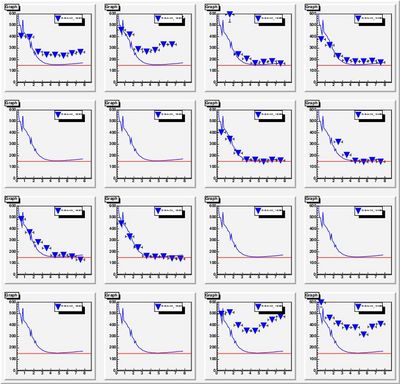
| + | Below 70/30 gas mixture ch 7: left MC, right data | ||
| + | |||
| + | {| border="1" cellpadding="2" | ||
| + | |- | ||
| + | |width="415pt"|[[Image:res7mc.jpg|thumb|none|400px|Resolutions as a function of drift distance (MC).]] | ||
| + | |width="415pt"|[[Image:res7data.jpg|thumb|none|400px|Resolutions as a function of drift distance (data).]] | ||
|- | |- | ||
|} | |} | ||
Latest revision as of 15:55, 23 July 2009
Contents
Prelude
- Two gases are used: 70/30 and 90/10 Ar/CO2
- Two fADC clock settings are used: 125 and 200 MHz
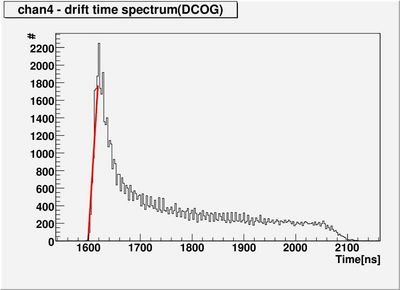
- Drift time spectra (DCOG method is used):
- Red line is fit to get absolute minimal drift time
- Best tracking results if extracted minimal drift time + 1 time sample
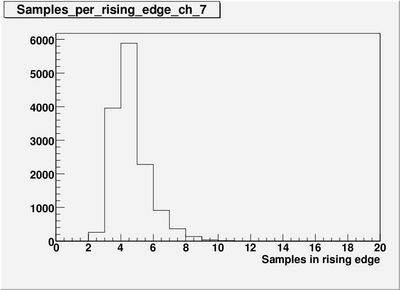
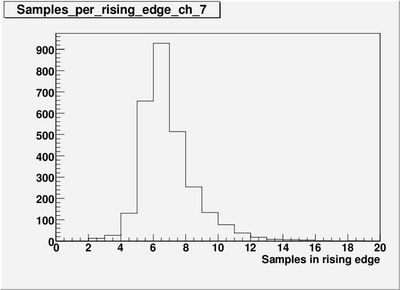
- Samples per rising edge - 2 extra samples 125 -> 200 MHz
- Time-2-distance relation:
- GARFIELD is used. To get best resolutions out of it:
- 68/32 Ar/CO2 is put in GARFIELD for 70/30 gas
- 89/11 Ar/CO2 is put in GARFIELD for 90/10 gas
- +-6% CO2 can give 100~ns difference
- GARFIELD is used. To get best resolutions out of it:
Resolutions
- Difference in gases - blue line is a model prediction:
- 90/10 worse because shorter drift times.
- Model contains:
- Timing resolution (0.75 length of time sample)
- accuracy
- diffusion (Garfield)
- Table with resolutions for straw 7 and different clock settings:
- high: with hit removed from tracking
- low: with hit included
| Distance from wire [mm] | Resolution (low) [um] | Resolution (high [um] | ||
|---|---|---|---|---|
| 125 MHz | 200 MHz | 125 MHz | 200 MHz | |
| 0-1 | 388 | 394 | 404 | 396 |
| 1-2 | 346 | 292 | 346 | 205 |
| 2-3 | 209 | 191 | 222 | 210 |
| 3-4 | 142 | 135 | 166 | 165 |
| 4-5 | 118 | 96 | 164 | 151 |
| 5-6 | 85 | 88 | 148 | 164 |
| 6-7 | 67 | 70 | 165 | 174 |
| 7-8 | 65 | 63 | 158 | 169 |
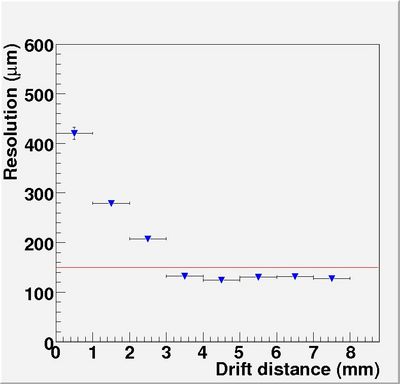
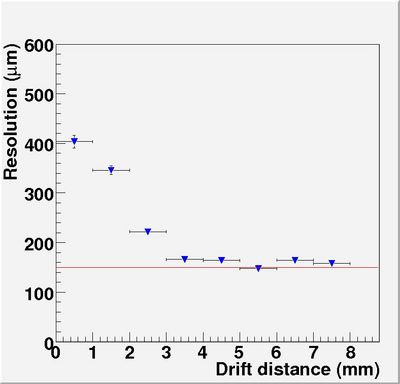
- The difference between high and low is largest for 1-3 mm driftdistances but overall the difference is not that big.
- Gas mixture has a big impact
- We might not have a big enough lever arm:
GARFIELD - DATA
Below 70/30 gas mixture ch 7: left MC, right data
To do
- There is a full simulation of the chamber and results are on there way
- We are testing 80/20 gas right now
- We want to test the same gas mixture as FDC uses
- We also want to try and add ethane
- Try different timing algorithms
- Find a way to extract the timing resolution directly

