Difference between revisions of "Recoil proton reconstruction"
From GlueXWiki
| Line 75: | Line 75: | ||
* '''Proton momentum and polar angle resolutions''' | * '''Proton momentum and polar angle resolutions''' | ||
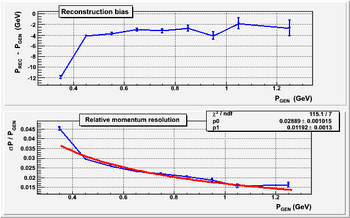
| − | [[Image:p_pi_mom_res.png | | + | [[Image:p_pi_mom_res.png | 350px]] |
# Reconstruction bias (top). The mean value of residuals, < p_rec - p_gen >, as a function of p_gen. | # Reconstruction bias (top). The mean value of residuals, < p_rec - p_gen >, as a function of p_gen. | ||
# Energy resolution dp/p (bottom). The distribution was fit to the function p1/sqrt(x) + p2 | # Energy resolution dp/p (bottom). The distribution was fit to the function p1/sqrt(x) + p2 | ||
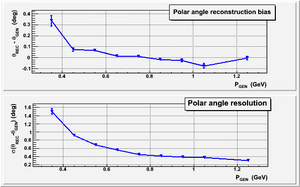
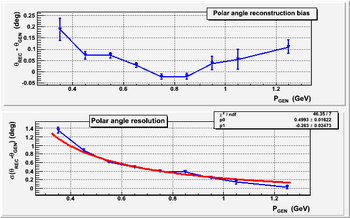
| − | [[Image:p_pi_theta_res.png | | + | [[Image:p_pi_theta_res.png | 350px]] |
# Reconstruction bias (top). The mean value of residuals, < theta_rec - theta_gen >, as a function of theta_gen. | # Reconstruction bias (top). The mean value of residuals, < theta_rec - theta_gen >, as a function of theta_gen. | ||
# Angular resolution sigma(theta) in degrees (bottom). The distribution was fit to the function p1/x + p2 | # Angular resolution sigma(theta) in degrees (bottom). The distribution was fit to the function p1/x + p2 | ||
| Line 87: | Line 87: | ||
* '''pi0 missing mass distribution''' | * '''pi0 missing mass distribution''' | ||
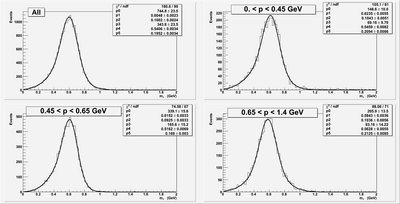
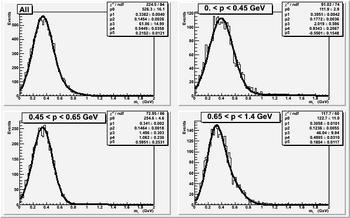
| − | [[Image:p_pi_mis_mas.png | | + | [[Image:p_pi_mis_mas.png | 350px]] |
# Missing masses were computed for different momentum ranges of generated protons. Reconstructed proton tracks were required to satisfy chi2/ndof < 10. The top left plot represents the missing mass distribution for all reconstructed protons. | # Missing masses were computed for different momentum ranges of generated protons. Reconstructed proton tracks were required to satisfy chi2/ndof < 10. The top left plot represents the missing mass distribution for all reconstructed protons. | ||
| Line 102: | Line 102: | ||
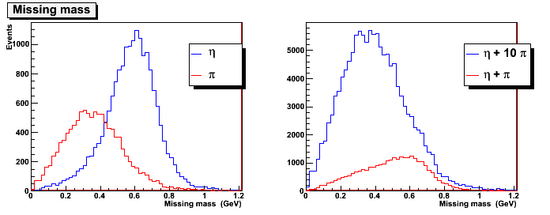
* '''Missing mass distributions for pi0 and eta''' | * '''Missing mass distributions for pi0 and eta''' | ||
| − | [[Image:comp_mis_mas.png | | + | [[Image:comp_mis_mas.png | 550px]] |
Revision as of 00:28, 2 October 2011
gamma p -> p eta decays
- Recoil proton kinematics
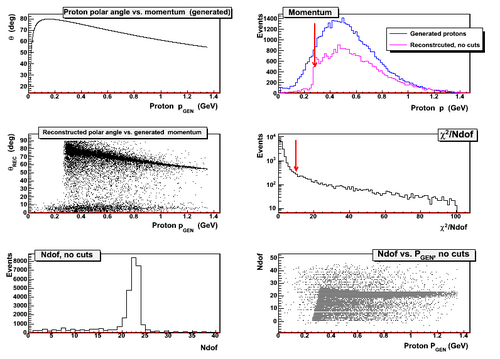
- Proton polar angle versus proton for generated events (top left)
- Momentum distributions for generated and reconstructed protons as a function of the p generated momentum (top right)
- Polar angle of reconstructed protons as a function of the generated proton momentum (middle left)
- Chisq/Ndof for reconstructed protons (middle right)
- Ndof distribution (bottom left)
- Ndof versus proton momentum (bottom right)
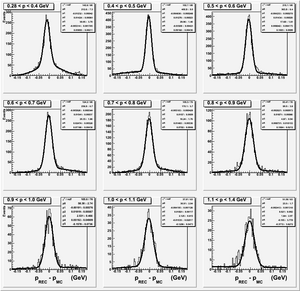
- Proton momentum residuals
p(rec) - p(gen) as a function of the genarted proton's momentum.
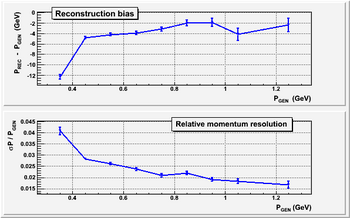
- Momentum resolution and reconstruction bias
- Reconstruction bias (top). The mean value of residual distributions, < p_rec - p_gen >, as a function of the proton generated momentum, p_gen.
- Energy resolution dp/p (bottom).
- Polar angle of reconstructed protons
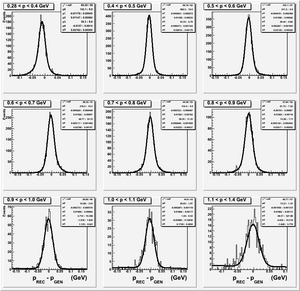
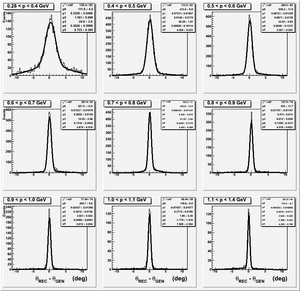
- Polar angle residuals, theta_rec - theta_gen (left plot)
- Polar angle resolution (right plot):
- < theta_rec - theta_gen >, as a function of the proton generated momentum, p_gen (top).
- sigma(theta) in units if degree (bottom).
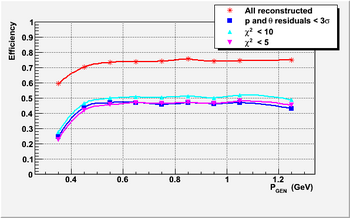
- Proton reconstruction efficiency
- Eta missing mass distribution
- Missing masses were computed for different momentum ranges of
generated protons. Reconstructed proton tracks were required to satisfy chi2/ndof < 10. The top left plot represents the missing mass distribution for all reconstructed protons.
gamma p -> p pi0 decays
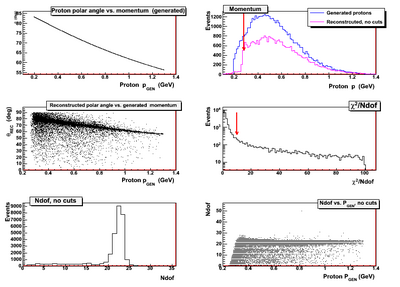
- Recoil proton kinematics
- Proton polar angle versus proton momentum for generated events (top left)
- Momentum distributions for generated and reconstructed protons as a function of the p generated momentum (top right)
- Polar angle of reconstructed protons as a function of the proton generated momentum (middle left)
- Chisq/Ndof for reconstructed protons (middle right)
- Ndof distribution (bottom left)
- Ndof versus proton momentum (bottom right)
- Proton momentum and polar angle resolutions
- Reconstruction bias (top). The mean value of residuals, < p_rec - p_gen >, as a function of p_gen.
- Energy resolution dp/p (bottom). The distribution was fit to the function p1/sqrt(x) + p2
- Reconstruction bias (top). The mean value of residuals, < theta_rec - theta_gen >, as a function of theta_gen.
- Angular resolution sigma(theta) in degrees (bottom). The distribution was fit to the function p1/x + p2
- pi0 missing mass distribution
- Missing masses were computed for different momentum ranges of generated protons. Reconstructed proton tracks were required to satisfy chi2/ndof < 10. The top left plot represents the missing mass distribution for all reconstructed protons.
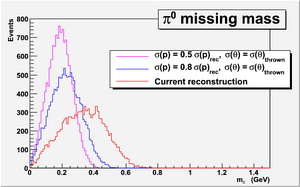
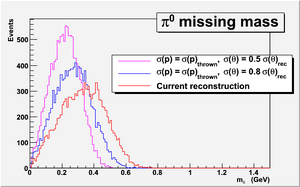
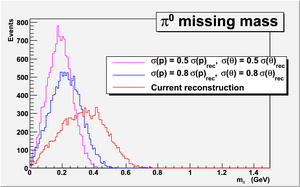
- Toy MC: pi0 missing mass distributions for various momentum and angular resolutions
- Missing mass distributions for pi0 and eta
