Difference between revisions of "RF DeltaTs"
From GlueXWiki
(→PSC) |
(→Summary) |
||
| Line 1: | Line 1: | ||
== Summary == | == Summary == | ||
| − | * Within each detector system, the | + | * Within each detector system, the time differences between the different RF signals in the event are histogrammed. |
* The hit # is not technically the Nth-hit in the event. Instead, it is calculated from the time. | * The hit # is not technically the Nth-hit in the event. Instead, it is calculated from the time. | ||
** For example, since the RF signal arrives every 2.004 ns and is read out 1/128 times, the second hit should be ~256.5 ns later than the first, the third ~513ns after the first, etc. Thus, the hit # is determined from the delta-t. This is because sometimes a hit is missing. | ** For example, since the RF signal arrives every 2.004 ns and is read out 1/128 times, the second hit should be ~256.5 ns later than the first, the third ~513ns after the first, etc. Thus, the hit # is determined from the delta-t. This is because sometimes a hit is missing. | ||
| − | ** | + | ** When plotting the mean of the time differences, the means are shifted in time such that they SHOULD line up at zero. E.g. if 2nd hit - 1st hit: expect to be centered at ~256.5 ns. So ~256.5ns is subtracted from the mean. |
* Note that sometimes there are two hits that roughly ~76ns apart from each other. They are identified as being the same hit #. The time difference between these is shown on the diagonal of the time difference distribution plots. | * Note that sometimes there are two hits that roughly ~76ns apart from each other. They are identified as being the same hit #. The time difference between these is shown on the diagonal of the time difference distribution plots. | ||
| − | ** This does not happen for the TOF (CAEN) only the other systems (F1TDCs). | + | ** This does not happen for the TOF (CAEN), only the other systems (F1TDCs). |
| − | ** The means/resolutions/etc. of these hits are not shown in the characteristics summary histograms, as their values tend to dominate the other bins. | + | ** The means/resolutions/etc. of these hits are not shown in the characteristics summary histograms, as their values tend to dominate the other bins. |
== TAGH == | == TAGH == | ||
Revision as of 10:23, 11 November 2016
Summary
- Within each detector system, the time differences between the different RF signals in the event are histogrammed.
- The hit # is not technically the Nth-hit in the event. Instead, it is calculated from the time.
- For example, since the RF signal arrives every 2.004 ns and is read out 1/128 times, the second hit should be ~256.5 ns later than the first, the third ~513ns after the first, etc. Thus, the hit # is determined from the delta-t. This is because sometimes a hit is missing.
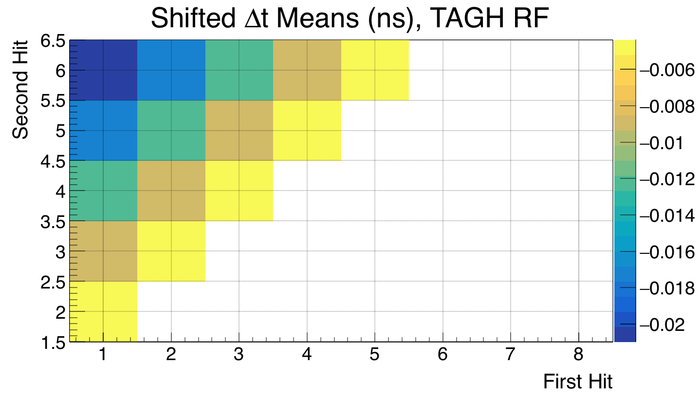
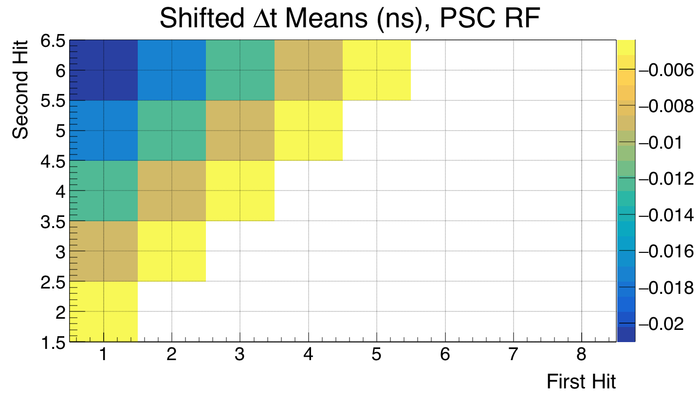
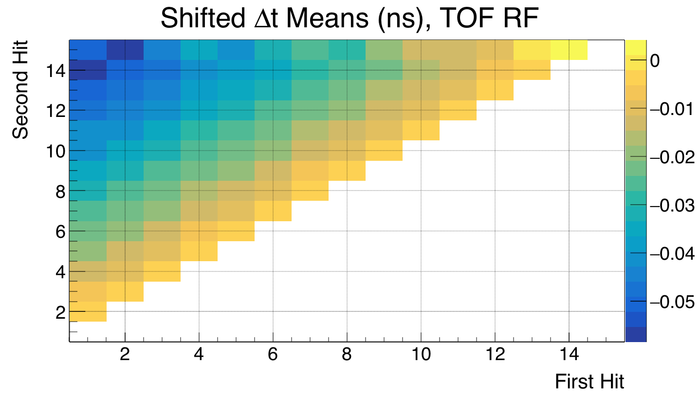
- When plotting the mean of the time differences, the means are shifted in time such that they SHOULD line up at zero. E.g. if 2nd hit - 1st hit: expect to be centered at ~256.5 ns. So ~256.5ns is subtracted from the mean.
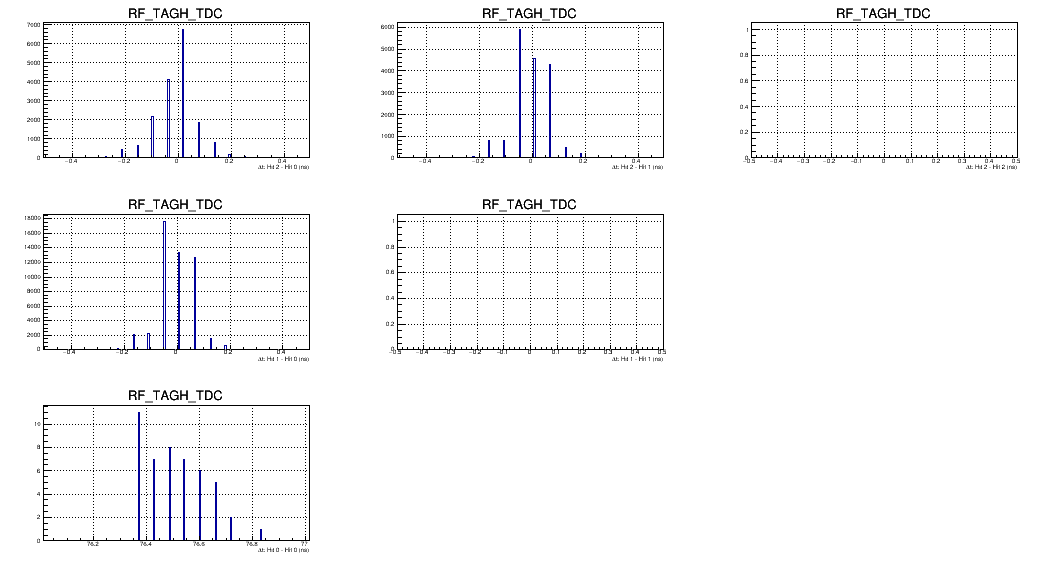
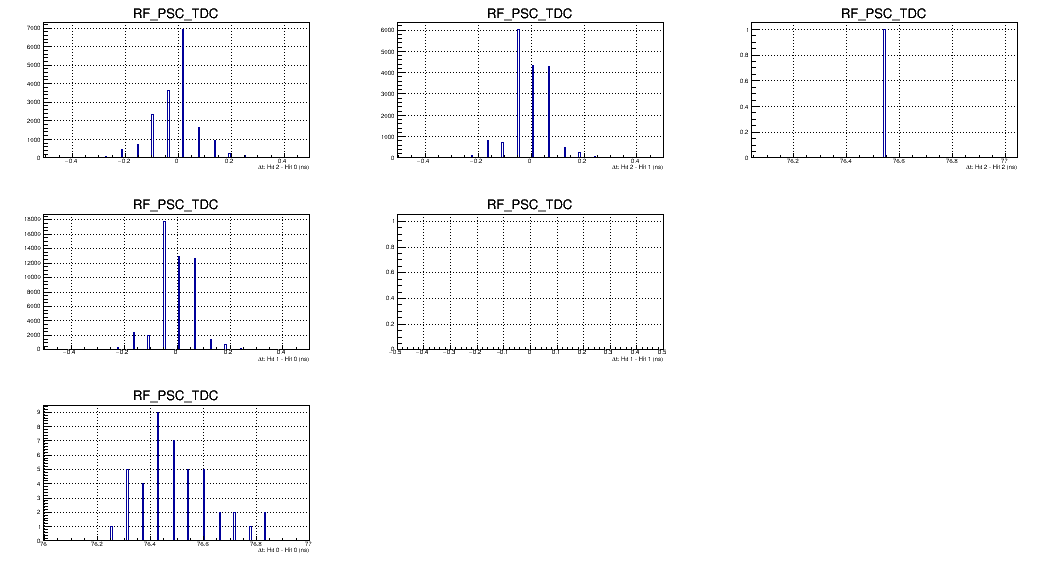
- Note that sometimes there are two hits that roughly ~76ns apart from each other. They are identified as being the same hit #. The time difference between these is shown on the diagonal of the time difference distribution plots.
- This does not happen for the TOF (CAEN), only the other systems (F1TDCs).
- The means/resolutions/etc. of these hits are not shown in the characteristics summary histograms, as their values tend to dominate the other bins.
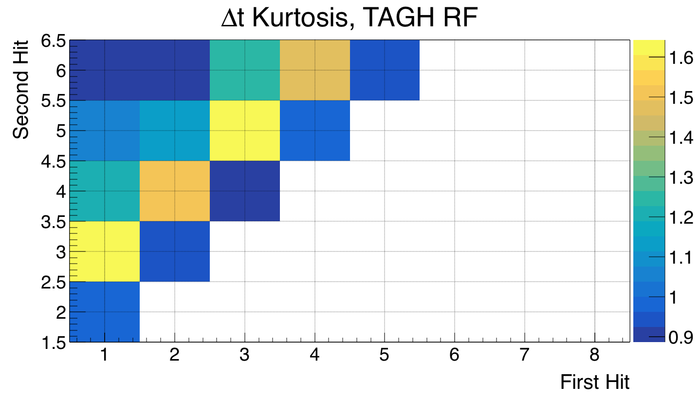
TAGH
- Time difference distributions (columns: earlier hit, rows: later hit)
- Diagonal: Hits with similar time
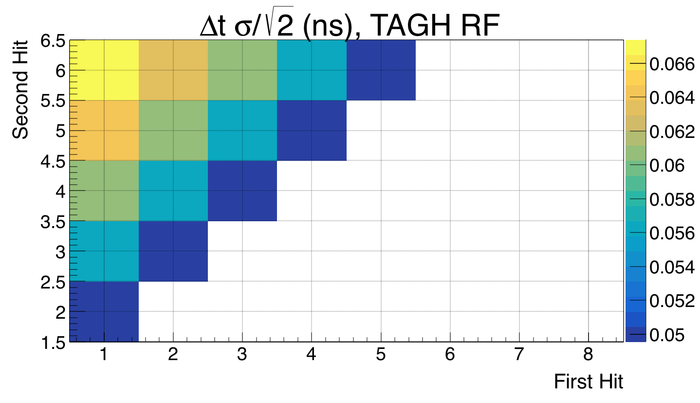
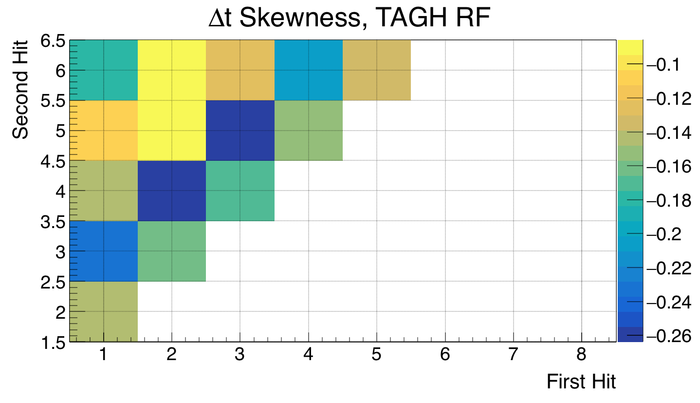
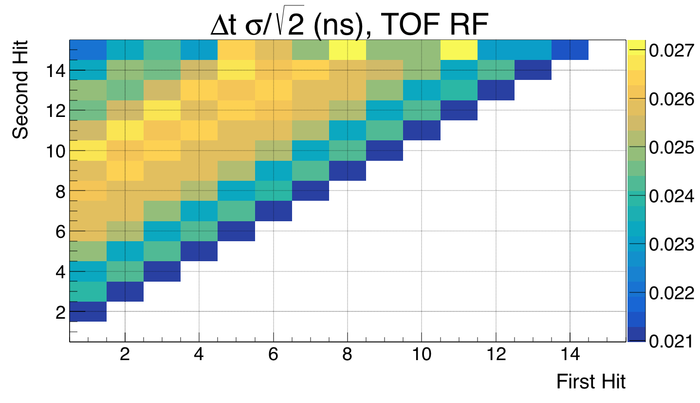
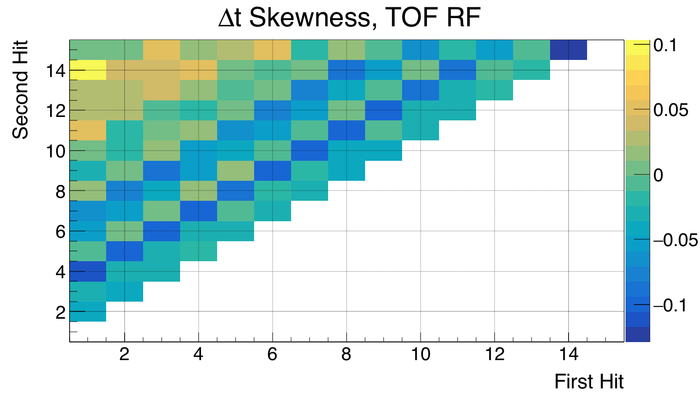
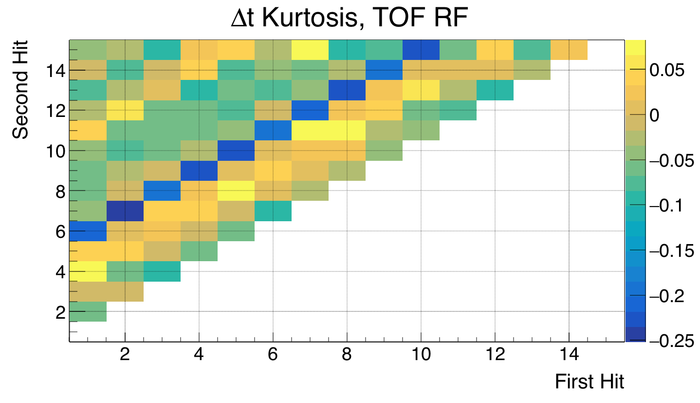
- Time difference characteristics
- Diagonal: Hits with similar time
PSC
- Time difference distributions (columns: earlier hit, rows: later hit)
- Diagonal: Hits with similar times
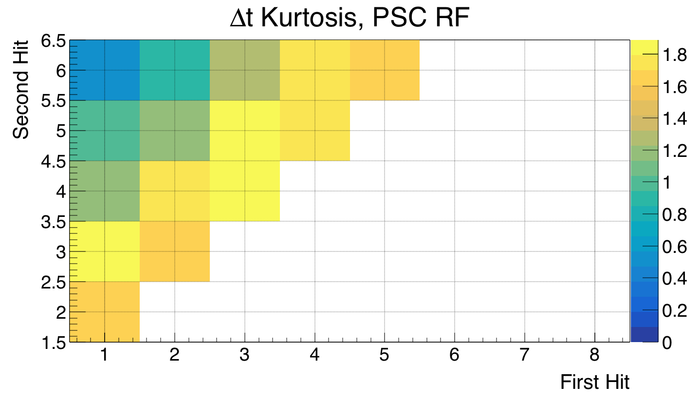
- Time difference characteristics
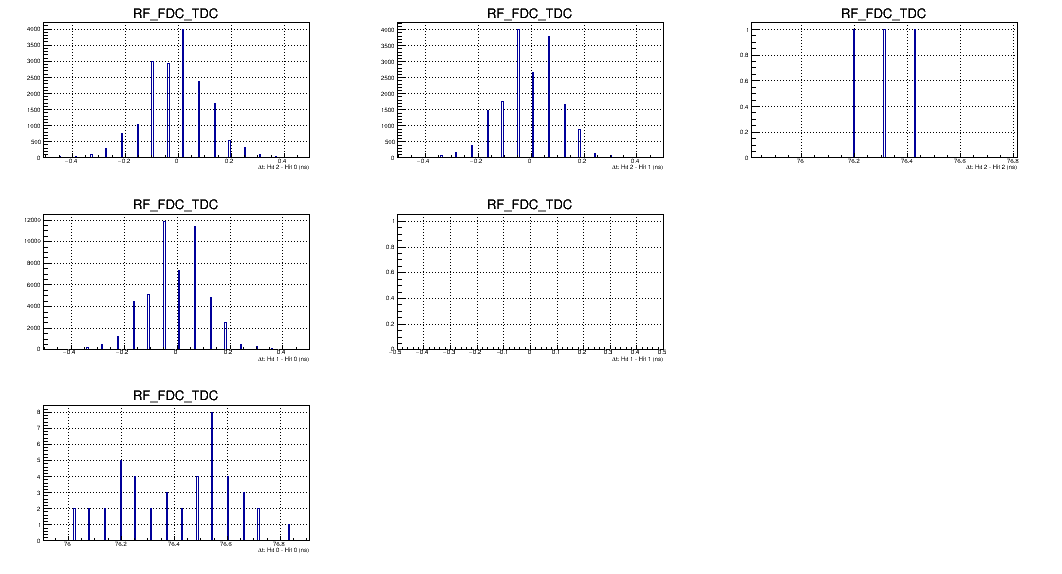
FDC
- Time difference distributions (columns: earlier hit, rows: later hit)
- Diagonal: Hits with similar time
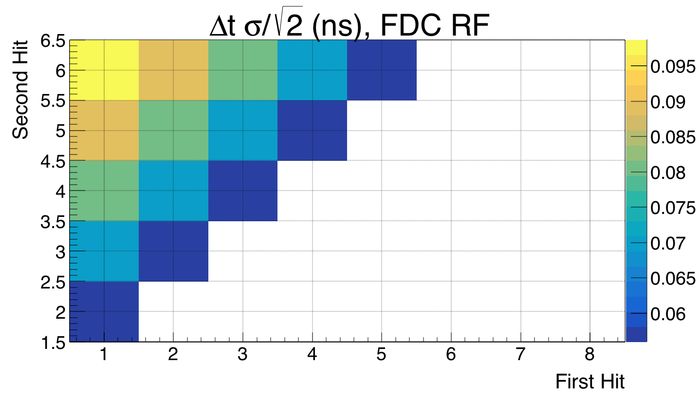
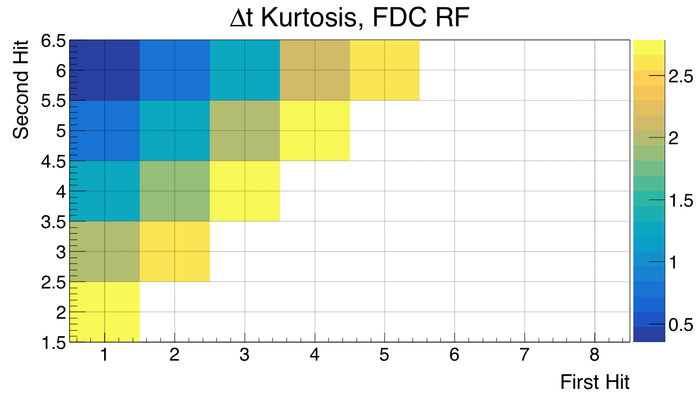
- Time difference characteristics
TOF
- Time difference distributions (columns: earlier hit, rows: later hit)
- Diagonal: Hits with similar time
- Time difference characteristics
