Difference between revisions of "Inspection with an electron microscope II"
m |
m |
||
| Line 9: | Line 9: | ||
|} | |} | ||
The relative X-ray analysis of a normal area gave three peaks C, Al, and O. The magnitude of the peaks compared as | The relative X-ray analysis of a normal area gave three peaks C, Al, and O. The magnitude of the peaks compared as | ||
| − | C > Al > O | + | C > Al > O. White spots are Ca = C = O > Al > P |
=== Under source (irradiated) === | === Under source (irradiated) === | ||
| Line 33: | Line 33: | ||
The relative X-ray analysis of a normal area gave three peaks C, Al, and O. The magnitude of the peaks compared as | The relative X-ray analysis of a normal area gave three peaks C, Al, and O. The magnitude of the peaks compared as | ||
C > Al > O, also the darker areas gave the same relative C > Al > O. | C > Al > O, also the darker areas gave the same relative C > Al > O. | ||
| + | |||
| + | |||
| + | == Lamina thin straw == | ||
| + | {| border="1" cellpadding="2" | ||
| + | |- | ||
| + | |width="415pt"|[[Image:lamina-thin-20um.jpg|thumb|none|400px|Lamina-thick straw that was irradiated (20um scale).]] | ||
| + | |- | ||
| + | |} | ||
| + | The relative X-ray analysis of a normal area (light gray) gave three peaks C, Al, and O. The magnitude of the peaks compared as | ||
| + | Al > C > O. The dark spots showed O > Al > C or O = Al > C . White spots are Ca = C = O > Al > P | ||
| + | |||
| + | == Lamina thick straw == | ||
| + | {| border="1" cellpadding="2" | ||
| + | |- | ||
| + | |width="415pt"|[[Image:lamina-thick-20um.jpg|thumb|none|400px|Lamina-thick straw that was irradiated (20um scale).]] | ||
| + | |- | ||
| + | |} | ||
| + | The relative X-ray analysis of a normal area gave one peak: Al. The white dots are Fe | ||
Revision as of 03:05, 12 March 2010
Contents
Stone kapton straw
Pristine
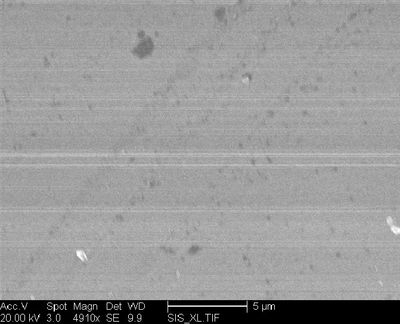
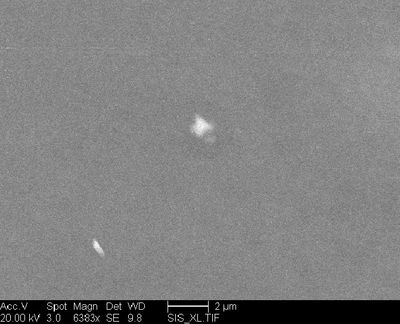
The relative X-ray analysis of a normal area gave three peaks C, Al, and O. The magnitude of the peaks compared as C > Al > O. White spots are Ca = C = O > Al > P
Under source (irradiated)
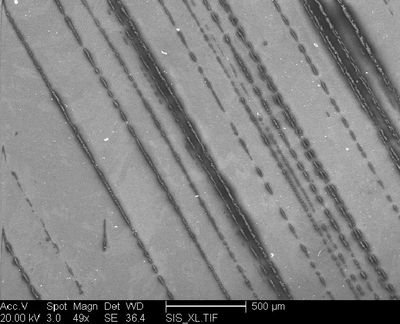
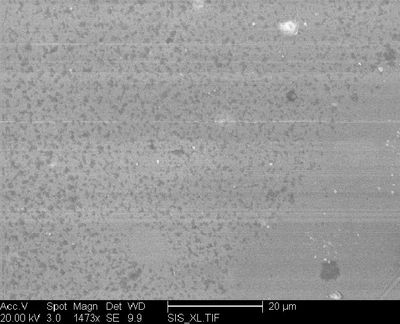
The relative X-ray analysis of a normal area gave three peaks C, Al, and O. The magnitude of the peaks compared as C > Al > O . The X-ray analysis of a dark spot gave C = 0 > Al. Also the darker the spot the more O present.
3 years under voltage (big prototype)
The relative X-ray analysis of a normal area gave three peaks C, Al, and O. The magnitude of the peaks compared as C > Al > O, also the darker areas gave the same relative C > Al > O.
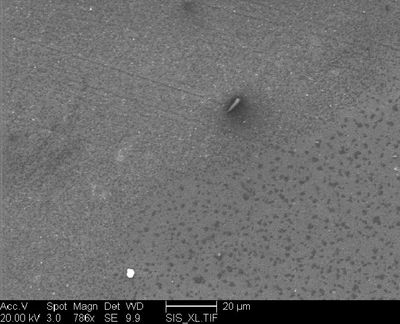
Lamina thin straw
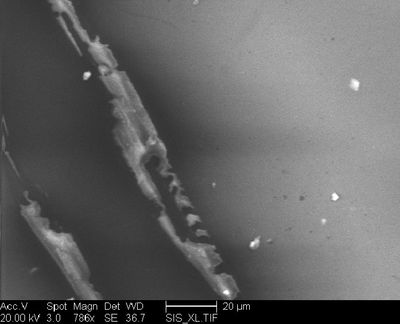
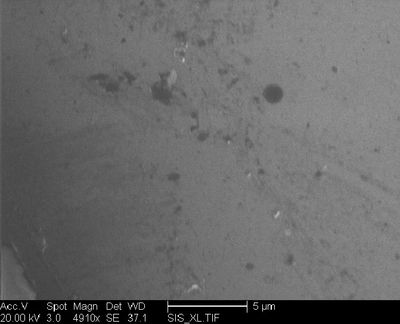
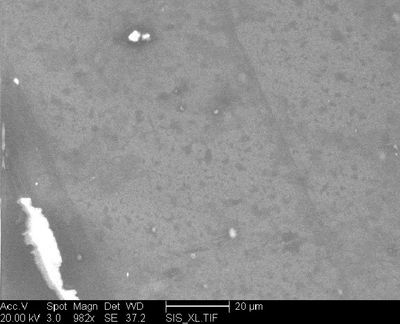
The relative X-ray analysis of a normal area (light gray) gave three peaks C, Al, and O. The magnitude of the peaks compared as Al > C > O. The dark spots showed O > Al > C or O = Al > C . White spots are Ca = C = O > Al > P
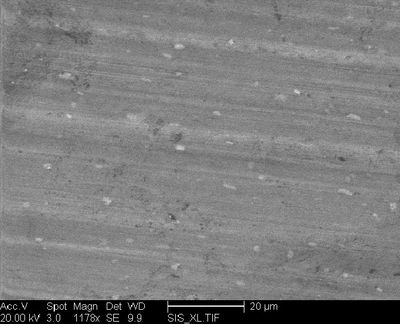
Lamina thick straw
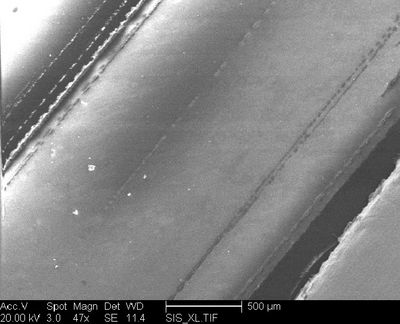
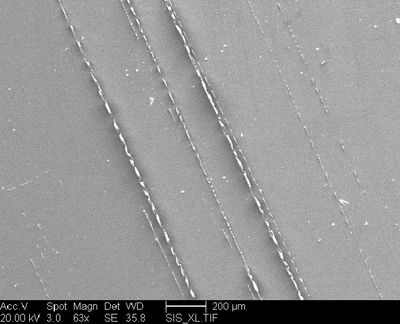
The relative X-ray analysis of a normal area gave one peak: Al. The white dots are Fe
