Difference between revisions of "How the crystal curvature affects the rocking curve width"
From GlueXWiki
| Line 1: | Line 1: | ||
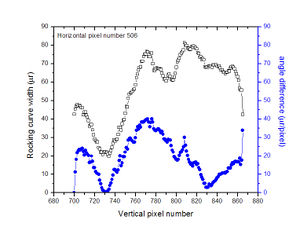
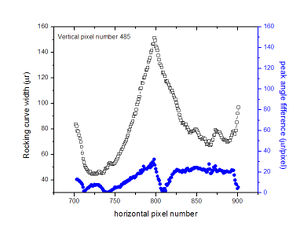
| − | In regions of a crystal where the local curvature is large along the direction perpendicular to the rocking axis, a significant part of the rocking curve peak width for a pixel can arise from variation of the peak position within the pixel. The following plots show | + | In regions of a crystal where the local curvature is large along the direction perpendicular to the rocking axis, a significant part of the rocking curve peak width for a pixel can arise from variation of the peak position within the pixel. The following plots show significant differences between the rocking curve widths observed in the (-2 2 0) and (2 2 0) orientations that may be attributed to the differences in the local curvature along the two axes. |
{|align="center" | {|align="center" | ||
|[[Image:curvatureeff1.jpg|thumb|hi there]] | |[[Image:curvatureeff1.jpg|thumb|hi there]] | ||
|[[Image:curvatureeff2.jpg|thumb|hi there]] | |[[Image:curvatureeff2.jpg|thumb|hi there]] | ||
|} | |} | ||
Revision as of 08:43, 10 March 2007
In regions of a crystal where the local curvature is large along the direction perpendicular to the rocking axis, a significant part of the rocking curve peak width for a pixel can arise from variation of the peak position within the pixel. The following plots show significant differences between the rocking curve widths observed in the (-2 2 0) and (2 2 0) orientations that may be attributed to the differences in the local curvature along the two axes.

