Difference between revisions of "HOWTO generate Bethe-Heitler pairs in the GlueX target"
(→Sample plots) |
(→Sample plots) |
||
| Line 31: | Line 31: | ||
===Sample plots=== | ===Sample plots=== | ||
| − | The total Bethe-Heitler cross section vs photon energy is obtained by plotting the average event weight in each energy bin. The plot on the left shows this result before the accept-reject filter, and on the right after the filter. After the filter, all of the events have the same weight so the filter effectively converts the weight into a convenient marker of the total Bethe-Heitler cross section at the specific photon energy for that event. The average cross section over the range 3-12 GeV is 13613 +/- 5 microbarns. The error bars shown in the plots are statistical. Note that the error bars show the modulation of the beam spectrum intensity across the coherent edge, but the estimated cross section is not affected. | + | The total Bethe-Heitler cross section vs photon energy is obtained by plotting the average event weight in each energy bin. The plot on the left shows this result before the accept-reject filter, and on the right after the filter. After the filter, all of the events have the same weight so the filter effectively converts the weight into a convenient marker of the total Bethe-Heitler cross section at the specific photon energy for that event. The average cross section over the range 3-12 GeV is 13613 +/- 5 microbarns. The error bars shown in the plots are statistical. Note that the error bars show the modulation of the beam spectrum intensity across the coherent edge, but the estimated cross section is not affected. The statistical errors are overestimated, especially in the right plot, because they are based on Poisson statistics, whereas the number of events in each bin was used to normalize the weights so the two are not statistically independent. |
[[File:BHtotalXS_weighted.png|600px]] [[File:BHtotalXS_unweighted.png|600px]] | [[File:BHtotalXS_weighted.png|600px]] [[File:BHtotalXS_unweighted.png|600px]] | ||
| + | |||
| + | Next I repeat the same experiment, but with a minimum pair mass of 1 GeV. Both of the plots below show weighted events, the left showing 1 GeV cut on a sample that was generated with no minimum pair mass in the generator, and the right showing an uncut sample generated with a 1 GeV minimum pair mass cut in the generator. | ||
===Example macros=== | ===Example macros=== | ||
Revision as of 20:09, 23 May 2020
The generation and simulation of Bethe-Heitler events in the GlueX spectrometer are both performed using the same hdgeant4 simulation program, by the following three-step procedure.
- A sample of beam photons from the GlueX radiator is generated over a limited spectral range, typically just the energy range of the tagger microscope and above. The coherent bremsstrahlung photon beam generator built into hdgeant4 is used for this. It gives a physically realistic photon transverse beam intensity profile incident on the GlueX target, with the proper energy and polarization spectrum. The correlation between energy and transverse position that is characteristic of coherent bremsstrahlung is correctly simulated. Using the following special configuration of control.in, every beam photon entering the liquid hydrogen target can be forced to undergo the Bethe Heitler process at a random location along the length of the target. The process is treated in a fashion fully consistent with tree-level QED, taking into account the polarization of the photon and both space-like and time-like form factors of the proton target. Internal radiative corrections are not currently included, but external radiation is automatically taken into account by the Geant4 tracking library. Check the following lines in control.in to make sure they are properly configured, then generate your Bethe-Heitler sample using the simple command "hdgeant4".
- INFIle 'xxx' - make sure this line is commented out
- TRIG 1000000 - set this to the number of Bethe-Heitler events you want to generate
- RUNG 51500 - or whatever run you want to simulate
- BEAM 12. 9.0 8.0 76.00 0.005 4.e-9 50.e-6 0.5e-3 - check the comments in control.in for the meaning of these fields
- GENBEAM 'BHgen' 2.156 - very important, make sure this line is there and not commented out, and replace 2.156 with the minimum pair invariant mass that you want to generate, or leave it blank to generate all pair masses.
- OUTFile 'my_BHgen.hddm' - or whatever you want to name the output file
- RNDM - if you are generating your sample in multiple batch jobs, make this unique for each job
- BGRATE - make sure this line is commented out
- TRAJ - make sure this line is commented out to prevent explosive growth of your output file
- CUTS - make sure this line is commented out to prevent the pairs/triplets from being pruned
- ... - the remaining lines don't matter much, leave the defaults
- The sample of pairs that were generated by GENBEAM 'BHgen' in step 1 now needs to be pruned. First of all, there are a significant number of pairs with a low energy electron or positron that is outside the GlueX acceptance. Second, the events are generated with unequal weights, and you probably want to implement an accept-reject filter to equalize the weights before you simulate them. Third, you probably want to look them over before investing in all of the cpu cycles that are needed to simulate and analyze your sample. Write your own ROOT macro to apply minimal cuts to satisfy the experimental trigger, implement the accept-reject filter, and make various plots to make sure they look like they should. You will write your filtered event sample to a new file, here named my_bhgen_filtered.hddm. Below you will find a couple of simple examples of ROOT macros to illustrate how to write your own filter.
- The filtered sample of generated pairs now needs to be simulated. For this, a new control.in configuration is needed. Once these edits are in place, simulate your generated sample with the command 'hdgeant4'. This will take a while, so you may want to subdivide your sample and run on the OSG.
- INFIle 'my_bhgen_filtered.hddm' - make sure this line is present and enabled
- TRIG 1000000000 - set this to greater than the number of events in your input file
- RUNG 51500 - or whatever run you want to simulate
- BEAM 12. 9.0 8.0 76.00 0.005 4.e-9 50.e-6 0.5e-3 - check the comments in control.in for the meaning of these fields
- BGRATE - if you want to simulate out-of-time tags, see associated comments in control.in for how to set this
- BGGATE - ditto
- GENBEAM 'BHgen' 2.156 - very important, make sure this line is NOT there or IS commented out
- OUTFile 'my_bhgen_sim.hddm' - or whatever you want to name the output file
- RNDM - if you are generating your sample in multiple batch jobs, make this unique for each job
- TRAJ - make sure this line is commented out to prevent explosive growth of your output file
- CUTS - make sure this line is commented out to prevent the pairs/triplets from being pruned
- ... - the remaining lines don't matter much, leave the defaults
Analysis
Analysis of the simulation results proceeds in the usual way, passing them through mcsmear to hd_root to your analysis TSelector. Instructions for all of that are beyond the scope of this document.
Sample plots
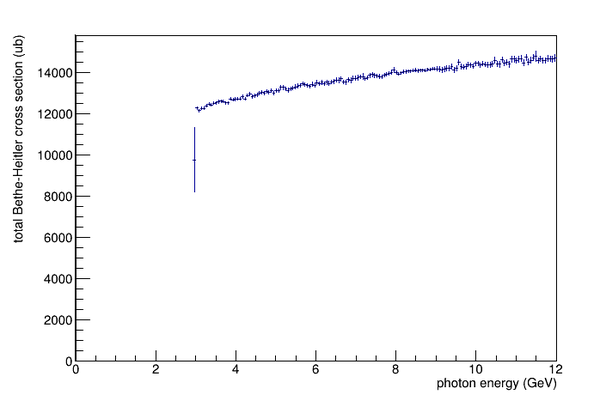
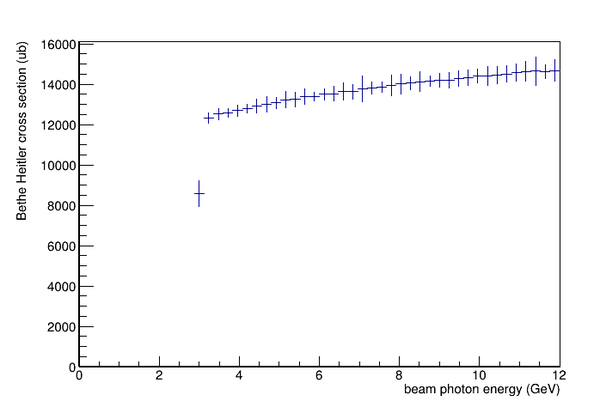
The total Bethe-Heitler cross section vs photon energy is obtained by plotting the average event weight in each energy bin. The plot on the left shows this result before the accept-reject filter, and on the right after the filter. After the filter, all of the events have the same weight so the filter effectively converts the weight into a convenient marker of the total Bethe-Heitler cross section at the specific photon energy for that event. The average cross section over the range 3-12 GeV is 13613 +/- 5 microbarns. The error bars shown in the plots are statistical. Note that the error bars show the modulation of the beam spectrum intensity across the coherent edge, but the estimated cross section is not affected. The statistical errors are overestimated, especially in the right plot, because they are based on Poisson statistics, whereas the number of events in each bin was used to normalize the weights so the two are not statistically independent.
Next I repeat the same experiment, but with a minimum pair mass of 1 GeV. Both of the plots below show weighted events, the left showing 1 GeV cut on a sample that was generated with no minimum pair mass in the generator, and the right showing an uncut sample generated with a 1 GeV minimum pair mass cut in the generator.
Example macros
- postconv.py - select events from postconv.hddm that should be simulated for a triplet polarimeter simulation.
- postsim.py - skim the results of a triplet polarimeter beam simulation for events that pass a minimal trigger requiring at least one triplet polarimeter hit and a coincidence in the pair spectrometer.
- count.py - reads simulation output (hddm) files and writes a ROOT tree containing the information needed to do an asymmetry measurement. It also contains simple methods for estimating the TPOL asymmetry based on the simulation results.
- epairXS.py - a simple ROOT utility for fitting the TPOL rate spectrum and estimating the asymmetry.

