Difference between revisions of "Gamma conversions in forward region"
| Line 10: | Line 10: | ||
Conversions that occur inside the solenoid produce preshowers that may be difficult to reconstruct in the FCal. The next plot shows the size (in units of LGD blocks) of the energy deposition in the FCal, as measured by the second central moment | Conversions that occur inside the solenoid produce preshowers that may be difficult to reconstruct in the FCal. The next plot shows the size (in units of LGD blocks) of the energy deposition in the FCal, as measured by the second central moment | ||
| − | <math>\frac{1}{N}\ | + | <math>\frac{1}{N}\sum_{i}^{N}E_i x_i^2-\left(\frac{1}{N}\sum_{i}^{N}E_i x_i\right)^2</math> |
Revision as of 07:21, 28 February 2007
A set of gamma rays were generated at the center of the target and tracked through the GlueX detector using HDGeant. The gamma momenta were generated
- uniform [0,6] GeV in energy,
- uniform [0,16] degrees in polar angle,
- uniform [0,360] degrees in azimuth.
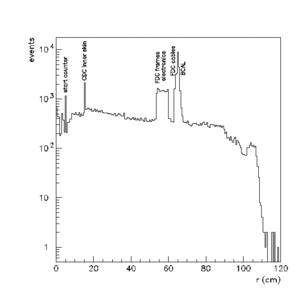
The following figures show the position in (r,z) where the gamma conversions occurred. The shadows of the detector elements in the forward region are clearly seen, notably the CDC envelope, the FDC frames and cables, and the TOF, as well as the BCal (blue dots) and the FCal.
Projections onto z and r of this distribution are shown in the following figures. The peaks in these log plots are labeled by the detector element that produces them.
Conversions that occur inside the solenoid produce preshowers that may be difficult to reconstruct in the FCal. The next plot shows the size (in units of LGD blocks) of the energy deposition in the FCal, as measured by the second central moment


