Difference between revisions of "CDC 28 11 2007"
(→Status Report on the CDC from 28 November 2007) |
m (→Status Report on the CDC from 28 November 2007) |
||
| Line 16: | Line 16: | ||
[[Image: FELspectrum.jpg|thumb|none|400px|Figure 5: Example of a FEL spectrum (CMN correction switched on).]] | [[Image: FELspectrum.jpg|thumb|none|400px|Figure 5: Example of a FEL spectrum (CMN correction switched on).]] | ||
How is this spectrum extracted? 1/ Only events that contain in at least one channel a signal above pedestal-mean + 5*pedestal-sigma are selected -- 2/ If there are multiple peaks in the spectrum, the one with the highest amplitude is selected -- 3/ the maximum has to be higher than 150 ADC channels and the signal minimum not lower than -100 -- 4/ the first bin of the signal is defined as the bin containing the minimum value + 2 -- 5/ the last bin is defined as the bin containing the signal maximum - 1 -- 5/ On the so obtained signal one of the two methods is applied. | How is this spectrum extracted? 1/ Only events that contain in at least one channel a signal above pedestal-mean + 5*pedestal-sigma are selected -- 2/ If there are multiple peaks in the spectrum, the one with the highest amplitude is selected -- 3/ the maximum has to be higher than 150 ADC channels and the signal minimum not lower than -100 -- 4/ the first bin of the signal is defined as the bin containing the minimum value + 2 -- 5/ the last bin is defined as the bin containing the signal maximum - 1 -- 5/ On the so obtained signal one of the two methods is applied. | ||
| + | Please note that 4 days of comics only yields 500 events/channel to fit a straight line to. | ||
As promised last week the design of the HV distribution board is shown in Picture 1. [[Image:HV_distributionboard.jpg|thumb|none|400px|Picture 1: Drawing of the High Voltage distribution board that is currently used with the CDC. The resistor values are: R01-16, R40, R50 = 1MOhm; R21-36 = 280 kOhm. The capacitors: C01-16, C40, C50 = 33 pF]] | As promised last week the design of the HV distribution board is shown in Picture 1. [[Image:HV_distributionboard.jpg|thumb|none|400px|Picture 1: Drawing of the High Voltage distribution board that is currently used with the CDC. The resistor values are: R01-16, R40, R50 = 1MOhm; R21-36 = 280 kOhm. The capacitors: C01-16, C40, C50 = 33 pF]] | ||
Revision as of 17:10, 27 November 2007
Status Report on the CDC from 28 November 2007
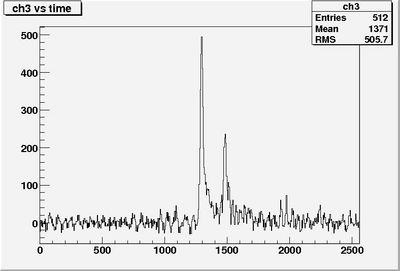
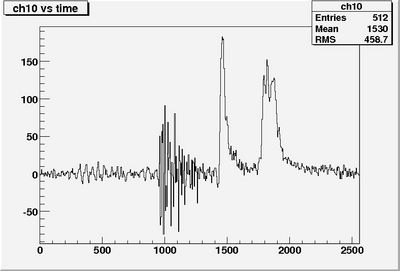
After 4 days of taking cosmic data it is time to look at some signals. Let's start by just showing the "raw" signals without any common mode noise (CMN) subtraction, a noisy signal is shown in figure 1, a "good" signal is shown in figure 2.
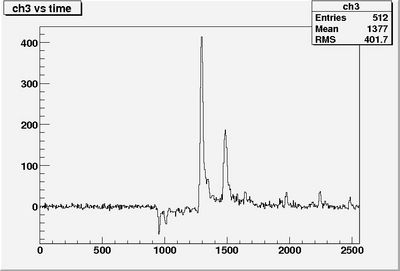
Lets compare this with the same signals but now with CMN subtraction, these are shown in figure 3 (noisy signal) and 4 ("good" signal).
What can be seen: 1/ for the noise signal the CMN subtraction does a good job, it significantly reduces the noise and the quality of the signal, fitting a straight line to the edge of the signal will be easier. 2/ the same can be said for the "good" signal but the impact there is less pronounced. 3/ The negative part in the corrected "good" signal is due to signals in other channels which are included in the CMN subtraction - this also causes a decrease in amplitude of the signal shown. We could solve this by only include channels in the CMN subtraction that do not contain a signal. 4/ The edge of the signal consists of 4-6 channels, which means 2-3 channels if we use the 100 MHz fADC.
Time to look at FEL/DCOG time spectra. What is a FEL time spectrum: every signal's rising edge is fit with a straight line and the zero crossing of that line (this is time called t_cross) is dumbed in a histogram. Actually one can use two methods to extract the zero crossing: the first electron method (FEL) and the differential center of gravity (DCOG) method. In the DCOG method the differences between adjacent channels for all channels from the start to the maximum are computed. The "zero crossing" is defined as the center of gravity of these differences of samples.
Both of them are implemented and a resulting histogram (FEL) can be seen in figure 5.
How is this spectrum extracted? 1/ Only events that contain in at least one channel a signal above pedestal-mean + 5*pedestal-sigma are selected -- 2/ If there are multiple peaks in the spectrum, the one with the highest amplitude is selected -- 3/ the maximum has to be higher than 150 ADC channels and the signal minimum not lower than -100 -- 4/ the first bin of the signal is defined as the bin containing the minimum value + 2 -- 5/ the last bin is defined as the bin containing the signal maximum - 1 -- 5/ On the so obtained signal one of the two methods is applied. Please note that 4 days of comics only yields 500 events/channel to fit a straight line to.


