Difference between revisions of "CDC 23 01 2008"
From GlueXWiki
m (→Understanding the drift time spectrum) |
(→Understanding the drift time spectrum) |
||
| Line 1: | Line 1: | ||
== Understanding the drift time spectrum == | == Understanding the drift time spectrum == | ||
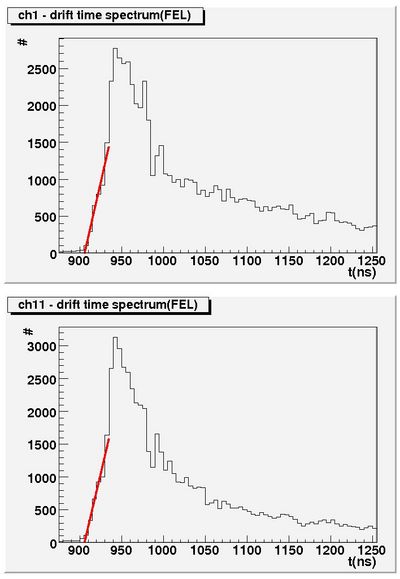
| − | As mentioned on the Collaboration meeting the drift time spectrum shown in figure 1 is not understood. One expects a drop-off around 1100 ns = 900 + 200, with 200 ns the maximum drift time in the straw. | + | As mentioned on the Collaboration meeting the drift time spectrum shown in figure 1 is not understood. One expects a drop-off around 1100 ns = 900 + 200 ns, with 200 ns the maximum drift time in the straw. |
[[Image:drifttime.jpg|thumb|none|400px|figure 1: two typical drift time spectra.]] | [[Image:drifttime.jpg|thumb|none|400px|figure 1: two typical drift time spectra.]] | ||
| + | |||
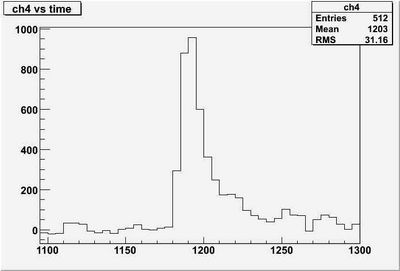
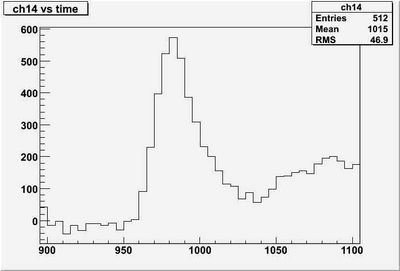
| + | First test was to look at the drift time spectra containing only hits from tracks. These spectra had the same shape. The second test was to look if the fADC was really running at 200 MHz. Therefore it was ran at 100 MHz and a signal with high amplitude was compared with the 200MHz ran fADC. In figure 2, the signal taken with the fADC ran at 100 MHz is shown in figure 3 the same but now with the fADC ran at 200 MHz. One can see clearly the difference between the two signals. | ||
| + | |||
| + | [[Image:100MHz.jpg|thumb|none|400px|figure 2: Signal vs time (100 MHz).]] | ||
| + | [[Image:200MHz.jpg|thumb|none|400px|figure 3: Signal vs time (200 MHz).]] | ||
Revision as of 18:54, 14 January 2008
Understanding the drift time spectrum
As mentioned on the Collaboration meeting the drift time spectrum shown in figure 1 is not understood. One expects a drop-off around 1100 ns = 900 + 200 ns, with 200 ns the maximum drift time in the straw.
First test was to look at the drift time spectra containing only hits from tracks. These spectra had the same shape. The second test was to look if the fADC was really running at 200 MHz. Therefore it was ran at 100 MHz and a signal with high amplitude was compared with the 200MHz ran fADC. In figure 2, the signal taken with the fADC ran at 100 MHz is shown in figure 3 the same but now with the fADC ran at 200 MHz. One can see clearly the difference between the two signals.


