Difference between revisions of "CDC"
(→CDC Weekly Status Reports) |
(→CDC Weekly Status Reports) |
||
| Line 35: | Line 35: | ||
[[CDC_21_11_2007]] | [[CDC_21_11_2007]] | ||
| + | |||
| + | [[CDC_14_11_2007]] | ||
==Status Report on the CDC from 28 November 2007== | ==Status Report on the CDC from 28 November 2007== | ||
Revision as of 15:06, 27 November 2007
Contents
The GlueX Central Drift Chamber
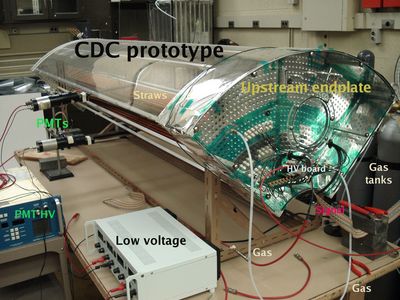
The CDC is a straw tube chamber that sits around the target in the GlueX experiment. The straws nominally run parallel to the beamline with readout on the upstream end of the chamber. About 30% of the straws are tilted with a 6 degree stereo angle to provide a measurement of the z position in two regions along the track. Tracks going more forward than about 30 degrees will also be tracked by the forward drift chamber system in the GlueX detector ( FDC ).
The 1.6cm diameter straws are arranged in 25 radial layers. The inner-most layer is at about 10cm and the outermost is at about 58cm from the beamline. The chamber is anticipated to achieve a 150 micron position resolution in the r-phi plane, which when conbined with the stereo information will yield a number of z measurements with resolution of about a mm.
The most up-to-date description of the CDC is found in GlueX-document 737 which can be found on the portal http://portal.gluex.org . There were also changes to this design that have been documents in GlueX-doc 744 and in document number 764 is the budget justification information for the chamber. All older documents should be considered out of date and probably inaccurate.
The CDC is being built by the Medium Energy Physics group at Carnegie Mellon University http://www.cmu.edu . The current members of the CMU group involved in this effort are:
- ) Curtis A. Meyer cmeyer@ernest.phys.cmu.edu
- ) Gregg Franklin gbfranklin@cmu.edu
- ) Yves Van Haarlem yvhaarle@ernest.phys.cmu.edu
- ) Matt Bellis bellis@ernest.phys.cmu.edu
- ) Gary Wilkin wilkin@ernest.phys.cmu.edu
CDC Weekly Status Reports
Status Report on the CDC from 28 November 2007
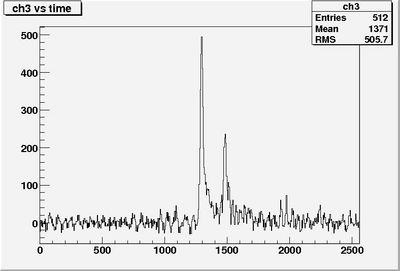
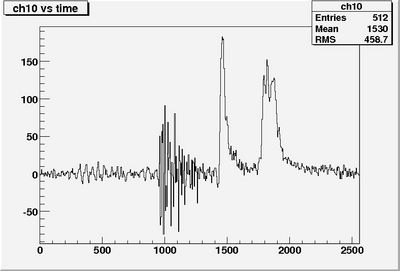
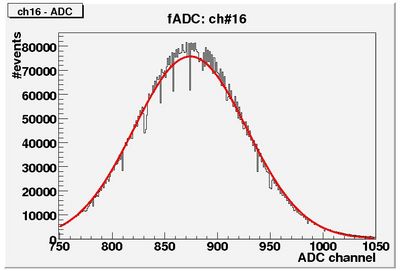
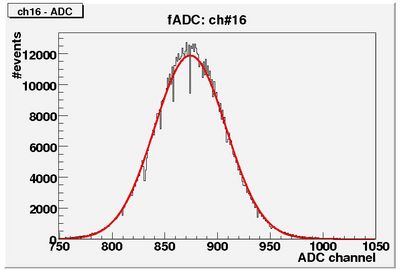
After 4 days of taking cosmic data it is time to look at some signals. Let's start by just showing the "raw" signals without any common mode noise (CMN) subtraction, a noisy signal is shown in figure 1, a "good" signal is shown in figure 2.
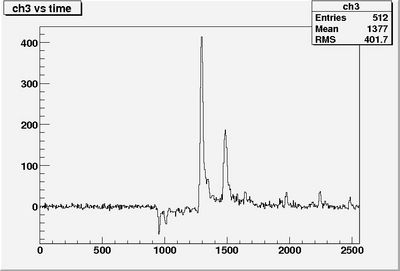
Lets compare this with the same signals but now with CMN subtraction, these are shown in figure 3 (noisy signal) and 4 ("good" signal).
What can be seen: 1/ for the noise signal the CMN subtraction does a good job, it significantly reduces the noise and the quality of the signal, fitting a straight line to the edge of the signal will be easier. 2/ the same can be said for the "good" signal but the impact there is less pronounced. 3/ The negative part in the corrected "good" signal is due to signals in other channels which are included in the CMN subtraction - this also causes a decrease in amplitude of the signal shown. We could solve this by only include channels in the CMN subtraction that do not contain a signal. 4/ The edge of the signal consists of 4-6 channels, which means 2-3 channels if we use the 100 MHz fADC.
Status Report on the CDC from 21 November 2007: Noise Studies
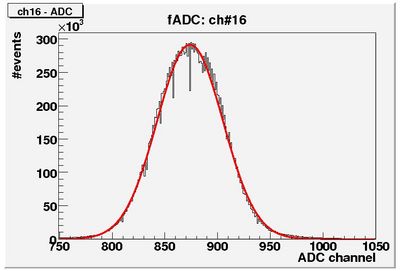
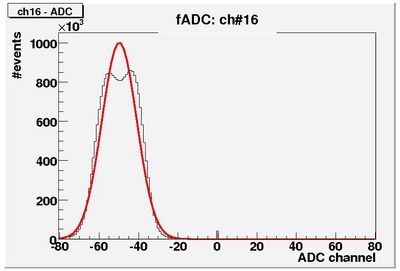
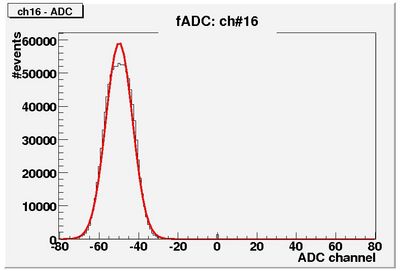
Now that all the electronics are mounted outside (see previous status report) it is possible to study the noise. Where should we start? Let's start by taking a reference, in figure 1, one can see a fit pedestal from channel 16 (= channel 8 on the second 200 MHz fADC) taken at the time before all electronics where moved out of the CDC. One sees a relatively broad Gaussian pedestal. Looking at the signals on the oscilloscope it was observed that the noise more or less looked the same on all channels. In order to subtract this common noise, a very simple common noise (CMN) subtraction algorithm was applied: the average "signal" of all straws, connected to the same fADC, was subtracted from the original signal. In the future a more complex algorithm can be applied, if necessary. The result of this CMN subtraction is shown in figure 2. Waw, the width of the noise-peak is reduced by almost a factor of 3! One can also see a double peak structure, we'll come back to this later.
Conclusion: we have to think about proper grounding for the final design.
Status Report on the CDC from 14 November 2007
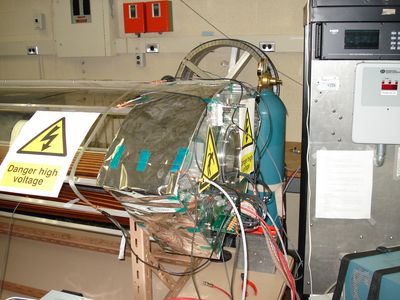
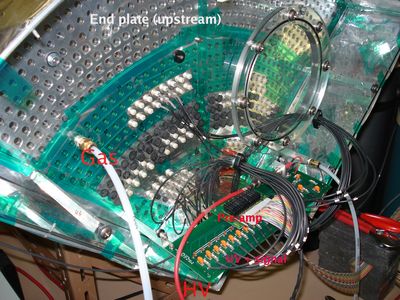
Since last week, we have mounted the chamber electronics on the outside of the chamber. We have also shifted the readout to only readout straight layers at this point in time. This will allow us to get a better handle on the chamber resolution using the 16 channels of readout that are available in the two Flash ADC units at CMU.
We have also carried out new GARFIELD calculations of the electrostatics of the chamber. We include here a field line plot ( File:GARFIELD FIELDLINES.PS ) for the current voltage and gas mixture as well as a time-to-distance relation ( File:GARFIELD-XTPLOT.PS ) which we use to convert the drift times to a distance from the wire.
Finally, Yves has started to implement a simple track finder based on the ideas of a Hough transform of the data. We are currently at the point where we need to write the track fitting algorithm which will allow us to start to extract resolution numbers from the chamber. This is based on the idea that the individual hits are represented as a small circle where we know the center (x,y) and radius r. The track needs to be tangent to all of the measured circles.

