Difference between revisions of "B1pi tests Sep. 2011"
| Line 31: | Line 31: | ||
[[Image:b1pi_standardgeom_photons_theta_zoom.gif|400px]] [[Image:b1pi_nobcalreadoutgeom_photons_theta_zoom.gif|400px]] | [[Image:b1pi_standardgeom_photons_theta_zoom.gif|400px]] [[Image:b1pi_nobcalreadoutgeom_photons_theta_zoom.gif|400px]] | ||
<br> | <br> | ||
| − | <b>The location of the sharp rise in reconstructed photons at around 10.5 degrees is the same in both plots. However the structure of the peak is slightly different. Without a BCAL readout in the geometry the bump is rather flat over about 4 degrees and then falls off rapidly. With the BCAL readout in the geometry this bump has some structure. The bump is about 3% higher and has a dip around 12 degrees but still is about 4 degrees wide before falling off rapidly. However even at angles of 20 degrees and beyond there is a significant overestimation of the number of reconstructed photons. Below 10.5 degrees the reconstructed number of photons is roughly 10 to 15 % higher than the generated number of photons except at very low angles where the acceptance of the FCAL cuts off. </b> | + | <b>The location of the sharp rise in reconstructed photons at around 10.5 degrees is the same in both plots. However the structure of the peak is slightly different. Without a BCAL readout in the geometry the bump is rather flat over about 4 degrees and then falls off rapidly. With the BCAL readout in the geometry this bump has some structure. The bump is about 3% higher and has a dip around 12 degrees but still is about 4 degrees wide before falling off rapidly. However even at angles of 20 degrees and beyond there is a significant overestimation of the number of reconstructed photons. This might be related to protons that failed to be reconstructed resulting in a calorimeter cluster without an associated track. |
| + | Below 10.5 degrees the reconstructed number of photons is roughly 10 to 15 % higher than the generated number of photons except at very low angles where the acceptance of the FCAL cuts off. </b> | ||
Revision as of 10:44, 2 September 2011
In the following the GlueX Monte Carlo and and analysis code revision 8233 as of end of August 2011 is used. 50000 b1pi events are generated for two geometries. One is the current standard geometry with a model of the BCAL readout including a copper cooling plate. A second geometry is identical with the exception that the BCAL readout part has been removed. This was done to see the impact of the BCAL readout on the reconstruction of these events. The event vertex is randomly distributed within the 30cm long target along the z-axis.
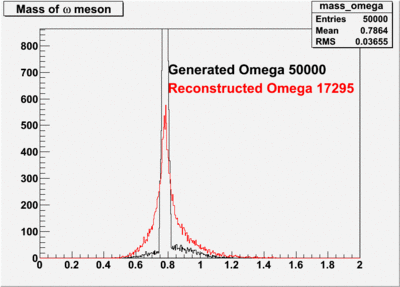
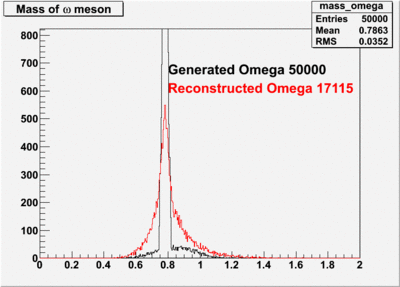
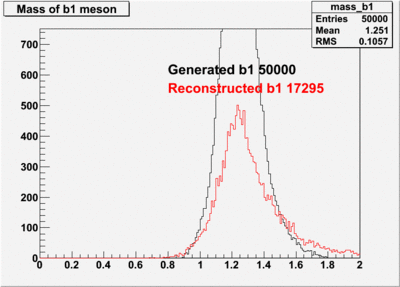
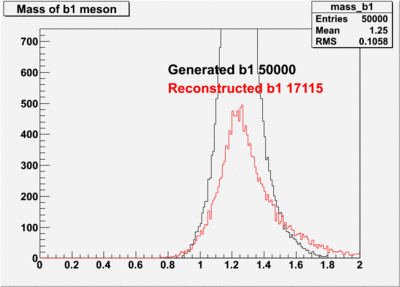
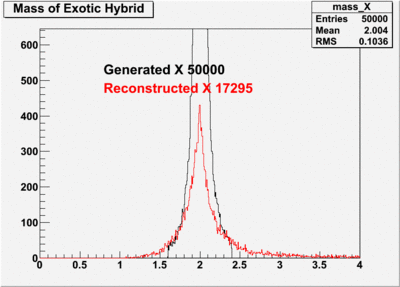
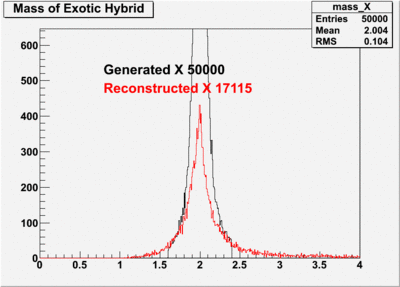
As one can see there is no obvious difference in the reconstructed mass distributions for pi0, omega, rho, b1 and X regarding the presence of the BCAL readout in the geometry of the simulation.
The pi0 mass (left=standard geometry, right=no Bcal readout):
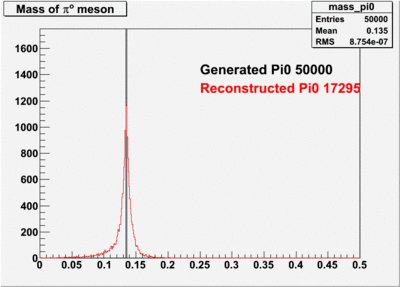
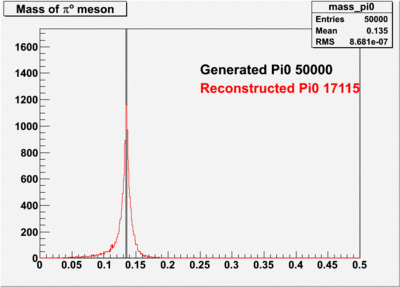
Here and in the following the black histograms are the thrown Monte Carlo values however the photon energies and charged particle momenta are smeared before the masses are reconstructed.
The omega mass (left=standard geometry, right=no Bcal readout):
The b1 mass (left=standard geometry, right=no Bcal readout):
The X mass (left=standard geometry, right=no Bcal readout):
To investigate the effect of the BCAL readout we look next at the distributions of photons and charged tracks as a function of angles as well as 2-dim. distributions of energy vs. angle for the different particle tracks.
Photon angular distribution (left=standard geometry, right=no Bcal readout):
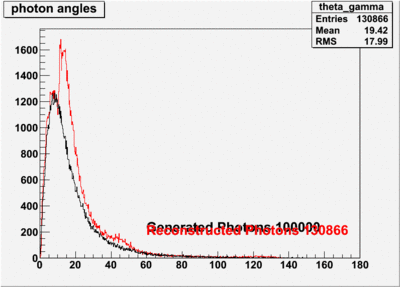
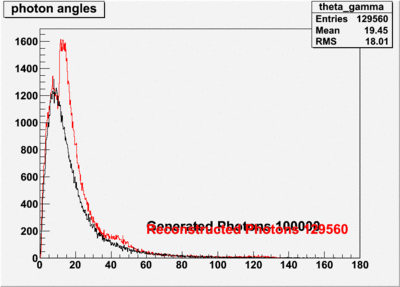
In the above plot the black are the thrown MC photons and in red are the reconstructed photons. Since 50k events are thrown we have 100k photons thrown. About 30% more photons are reconstructed. While there are always more photons reconstructed at all angles a significant overshot is seen at angles above 10.5 degree. This is the effect of shallow impact angles into the BCAL. More on this later. Also there is a small bump above 40 degrees. This is caused by protons that are miss identified as photons. This will become apparent when examining more plots below. The difference between having a BCAL readout in the geometry (left) or not (right) is very small and concentrated around the angle of 10.5 degree. So the next plots are a zoom into this region.
Photon angular distribution zoom (left=standard geometry, right=no Bcal readout):
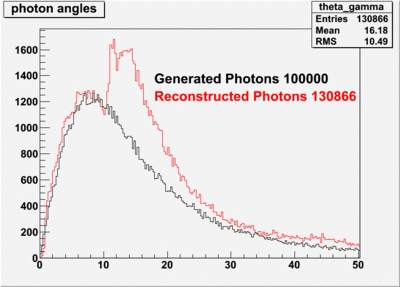
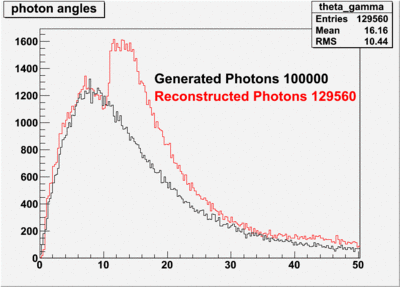
The location of the sharp rise in reconstructed photons at around 10.5 degrees is the same in both plots. However the structure of the peak is slightly different. Without a BCAL readout in the geometry the bump is rather flat over about 4 degrees and then falls off rapidly. With the BCAL readout in the geometry this bump has some structure. The bump is about 3% higher and has a dip around 12 degrees but still is about 4 degrees wide before falling off rapidly. However even at angles of 20 degrees and beyond there is a significant overestimation of the number of reconstructed photons. This might be related to protons that failed to be reconstructed resulting in a calorimeter cluster without an associated track.
Below 10.5 degrees the reconstructed number of photons is roughly 10 to 15 % higher than the generated number of photons except at very low angles where the acceptance of the FCAL cuts off.