To find the peak (signal) length I have to decide where the peak ends and noise takes over.
Histogram of difference between adc sample value and previous sample value for first 190 samples in many events (trigger is approx sample 200 so samples 0-190 should be almost all noise).
Change in adc value since previous sample, pre-trigger samples
|
|
|
Pedestal s.d is 11 (adc value) for these straws in this run. For other straws s.d. ranges from 9 to 13.
Change in adc value since previous sample, last 100 samples
|
|
|
Change in adc value since previous sample, last 50 samples
|
|
|
Peak length in ch20, counting from lower threshold crossing to end of peak
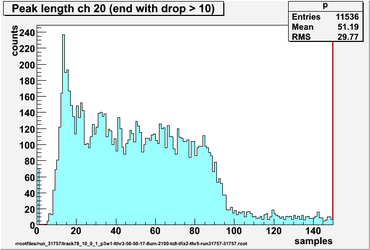 peak ends at last sample which decreases by 10 or more |
 peak ends at last sample which decreases by 12 or more |
 peak ends at last sample which decreases by 15 or more |
 peak ends at last sample which decreases by 20 or more |
Max drift time (according to Garfield) is 660ns
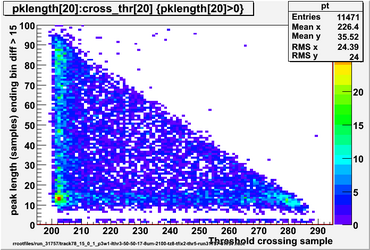
Peak length (ending at last sample decreasing >15)
 Peak length vs max amplitude Ch 20 (straw 17) |
 Peak length vs drift time Ch 20 (straw 17) |


