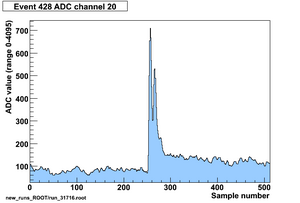
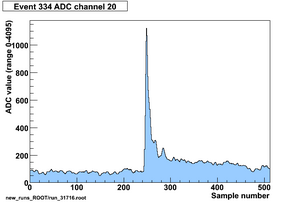
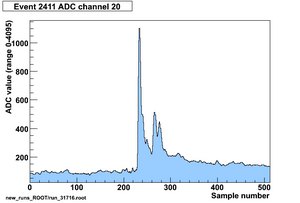
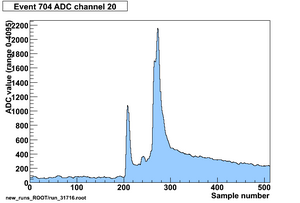
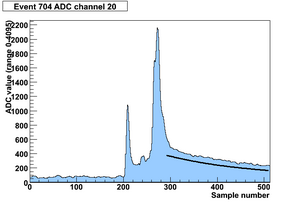
CDC prototype fADC data
From GlueXWiki
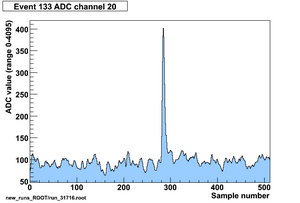
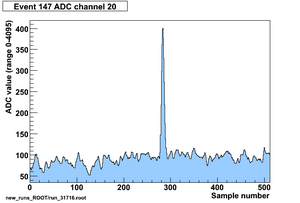
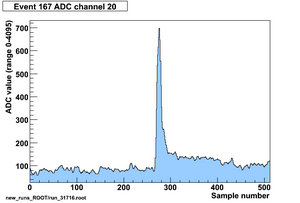
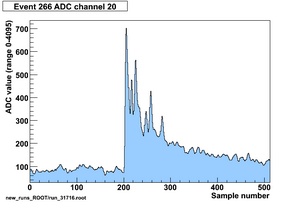
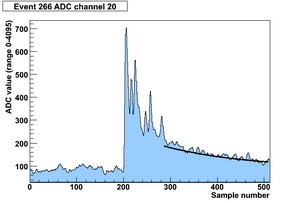
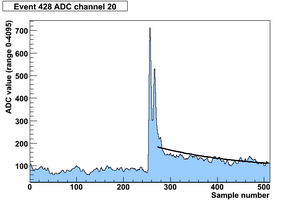
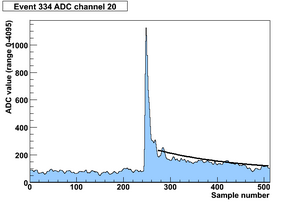
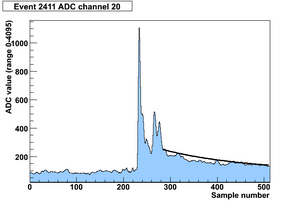
Data from cosmics with 50/50 gas, 2100V
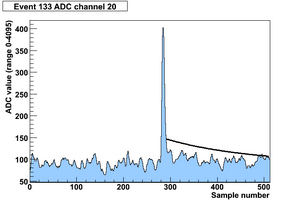
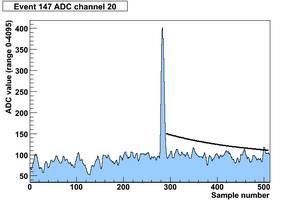
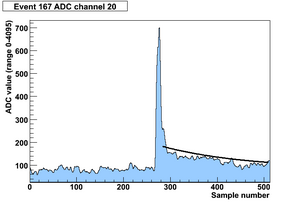
Fit attempt 1
Use pedestal before peak, max peak amplitude, end of peak. End of peak is 2 samples after the last sample where ADC value is at least 20 less than the previous sample. Function fitted to many events for range end-of-peak to final sample was pedestal + 0.14 * maxamp * exp(-0.0056*(x-endpeak)) where x=sample number. The constants were the mean values of the fitted function parameters.
Fit attempt 2
Use pedestal before peak, end of peak, integrated peak. Function fitted to many events for range end-of-peak to final sample was
pedestal + 0.0074 * integratedpeak * exp(-0.0056*(x-endpeak))
where x=sample number. The constants were the mean values of the fitted function parameters.
