Start Counter Operations 2017
Start Counter Performance 2017
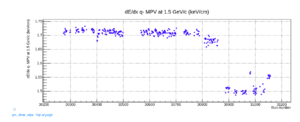
as of 2024:0921 the performance of the Start Counter can be interpreted by looking at the dEdx values shown in the SC deamon plot:

from these data one can clearly identify periods where there are significant changes that can be tradced back to changes in the response of the detector and is real and not an artefact of the calibration. For example, it can be shown that the ADC amplitudes of all the 30 paddles in run 30858 are about 7.8% larger than for run 30900. This is a significant change/drop in the response of the detector. This drop seems to happen immediate. There is no change in the operating voltage observed. And while the temperature of the CDC gas and the HallD air temperature monitored and recored in EPICS data base show some wired jumps around that time, the temperature became stable again at more or less previous values but the reduced response of the start counter paddles at the level of 7.8% remained almost to the end of the run Period. Starting with run 31046 there
is a smaller "jump" to a somewhat larger response again but still smaller than for earlier runs in the run period.
One can identify 4 distince time periods with different responses/gains of the start counter paddles based on the value of dEdx. These are:
- Run 30000 to 30800: pretty constant the variation is about 1%
- Run 30801 to 30880: small drop abut 2.5%
- Run 30888 to 31036: larger drop another 11%
- Run 31046 to end : small increase of about 3.3%
Note: One possible reason why the gain changes is a change in beam current/intensity. Run 30797 is the first run with 150nA e-beam current. Prior to that run the beam current was 100nA. Run 30883 to 30888 the beam e-beam current was at 200nA and after that was switched back to 150nA. For some of the last runs starting with run number 31046 the e-beam current was turned down to 40nA and later back up to 100nA.
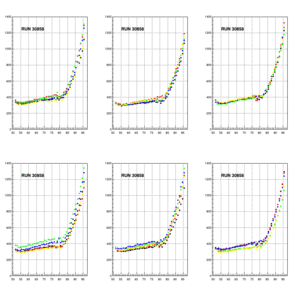
Demonstration of variation from paddle to paddle run 30858
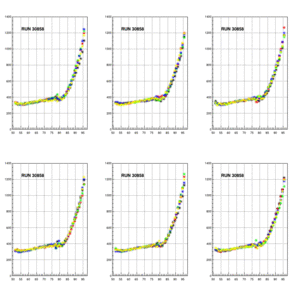
plotting the mean paddle resonse as a function of z along the beam line for all paddles separate divided into goups of 5. There are some visible variaitions of the detector response within some of the groups and less in others.
The first plot shows the raw data (pedestal subtracted)

and second plot has the values scaled to the mean value of ADC response of all paddles based on the data in the straight section:

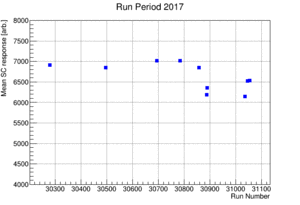
Mean SC paddle response over the Run period
The following plot shows the mean start counter paddle response using data (signal response) from the strait sections for some selected runs based on the observations above indicating stable conditions with small changes in the response.
