Drift time histograms for various local pedestal points
The local pedestal is taken to be the mean of a number of samples (pedestal window) ending a certain number of samples (pedestal lead time) before the bin where the hit crossing threshold is exceeded. Typically for a hit threshold of 5x pedestal sigma, a window of 1 or 2 samples ending at a lead time of 3 or 4 samples works well. For a window of 1 sample and lead time of 3 samples, the pedestal value is taken to be equal to the fADC value 3 samples before the hit threshold is exceeded.
Also see CDC_prototype_more_on_timing
In the histograms below...
The hit threshold is 5sigma and the (lower, earlier) timing threshold is 1sigma above pedestal.
Le_bin is the timing threshold crossing in fADC samples (8ns each), relative to the hit threshold crossing time.
Le_bin=0 corresponds to (15 + pedestal_lead) samples before the hit threshold crossing bin.
Le_bin=15 corresponds to pedestal_lead samples before the hit threshold crossing, this is where the pedestal window ends.
The 1-sigma threshold time is the bin where the 1-sigma timing threshold is crossed, relative to the trigger time,
ie the hit threshold crossing bin - 15 - pedestal_lead_time + le_bin.
20 + pedestal_lead_time values are used for upsampling, starting at le_bin=0 and ending 5 samples after the hit threshold crossing bin.
Threshold time (8ns samples) and leading edge time at 1-sigma with pedestal 2 bins before 5-sigma hit threshold crossing
|
|
|
|
|
Threshold time (8ns samples) and leading edge time at 1-sigma with pedestal 3 bins before 5-sigma hit threshold crossing
|
|
|
|
|
Threshold time (8ns samples) and leading edge time at 1-sigma with pedestal 4 bins before 5-sigma hit threshold crossing
|
|
|
|
|
Threshold time (8ns samples) and leading edge time at 1-sigma with pedestal 5 bins before 5-sigma hit threshold crossing
|
|
|
|
|
Threshold time (8ns samples) and leading edge time at 1-sigma with pedestal mean of 3 and 4 bins before 5-sigma hit threshold crossing
|
|
|
|
|
As above for untracked data and broader histogram bins (Threshold time (8ns samples) and leading edge time at 1-sigma with pedestal mean of 3 and 4 bins before 5-sigma hit threshold crossing)
|
|
|
|
colors:851,836,426,871,606,pink+1
leading edge time (1-sigma) vs threshold time (5-sigma), pedestal mean of 3&4 bins before hit threshold crossing)
|
|
Leading edge time for selected threshold times (as above)
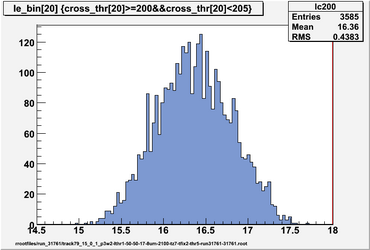 leading edge time for threshold time 200 to 204 bins |
 leading edge time for threshold time 220 to 229 bins |
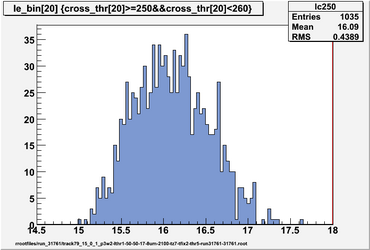 leading edge time for threshold time 250 to 259 bins |
Threshold time for selected leading edge times (as above)
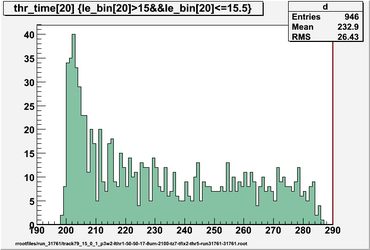 threshold time for leading edge time 15 to 15.5 bins |
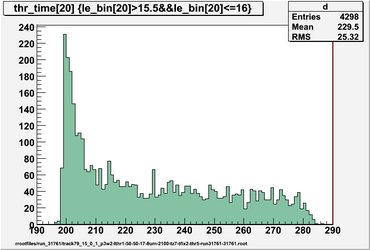 threshold time for leading edge time 15.5 to 16 bins |
Threshold time for selected leading edge times (as above)
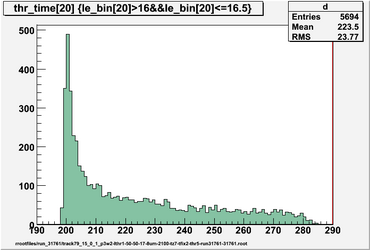 threshold time for leading edge time 16 to 16.5 bins |
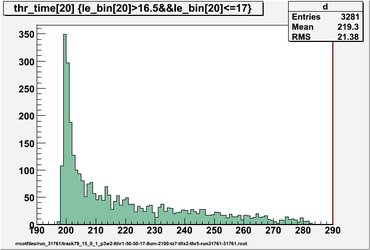 threshold time for leading edge time 16.5 to 17 bins |
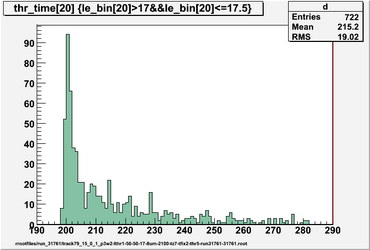 threshold time for leading edge time 17 to 17.5 bins |


