Difference between revisions of "CDC prototype fADC data"
From GlueXWiki
| Line 30: | Line 30: | ||
Fit attempt 1<br/> | Fit attempt 1<br/> | ||
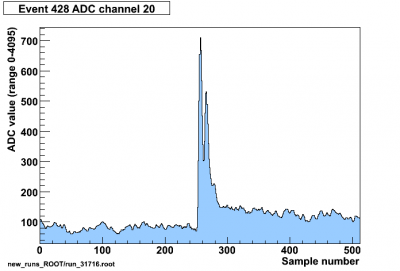
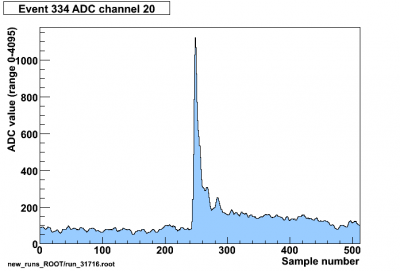
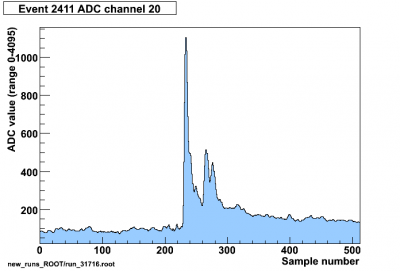
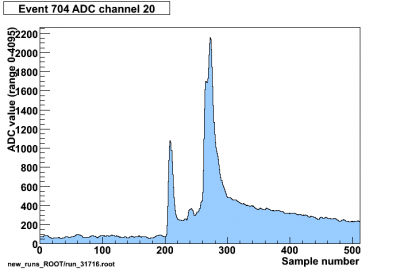
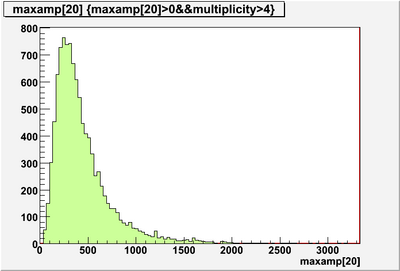
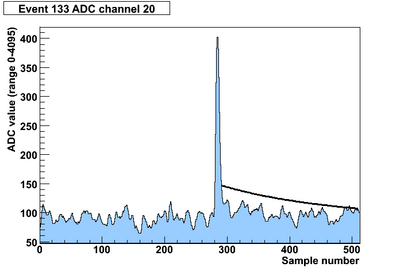
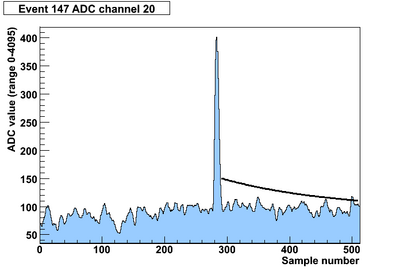
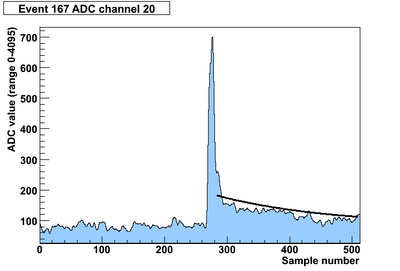
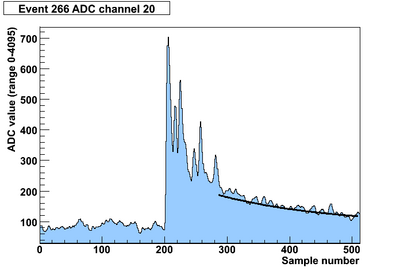
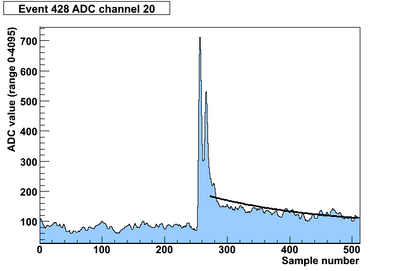
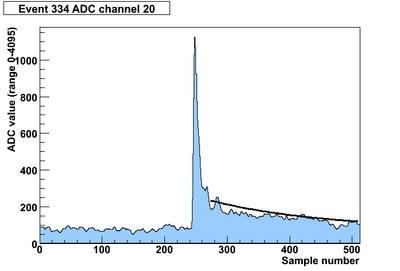
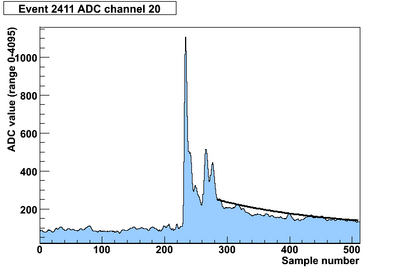
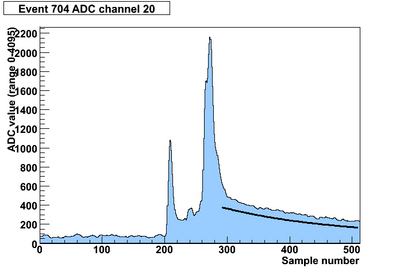
Use pedestal before peak, max peak amplitude, end of peak - this is the first sample with contents > 20 less than its neighbor, starting with the last sample and working forwards. Function fitted to many events for range end-of-peak to final sample was pedestal + 0.14 * maxamp * exp(-0.0056*(x-endpeak)) where x=sample number. The constants were the mean values of the fitted function parameters. | Use pedestal before peak, max peak amplitude, end of peak - this is the first sample with contents > 20 less than its neighbor, starting with the last sample and working forwards. Function fitted to many events for range end-of-peak to final sample was pedestal + 0.14 * maxamp * exp(-0.0056*(x-endpeak)) where x=sample number. The constants were the mean values of the fitted function parameters. | ||
| + | |||
| + | {| border="0" cellpadding="2" | ||
| + | |width="900pt"| | ||
| + | [[Image:1exp.png|thumb|900px ]] | ||
| + | |} | ||
{| border="0" cellpadding="2" | {| border="0" cellpadding="2" | ||
|width="400pt"| | |width="400pt"| | ||
| − | [[Image: | + | [[Image:fit133.png|thumb|400px]] |
| + | |width="400pt"| | ||
| + | [[Image:fit147.png|thumb|400px]] | ||
| + | |- | ||
| + | |width="400pt"| | ||
| + | [[Image:fit167.png|thumb|400px]] | ||
| + | |width="400pt"| | ||
| + | [[Image:fit266.png|thumb|400px]] | ||
| + | |width="400pt"| | ||
| + | [[Image:fit428.png|thumb|400px]] | ||
| + | |- | ||
| + | |width="400pt"| | ||
| + | [[Image:fit334.png|thumb|400px]] | ||
| + | |width="400pt"| | ||
| + | [[Image:fit2411.png|thumb|400px]] | ||
| + | |- | ||
| + | |width="400pt"| | ||
| + | [[Image:fit704.png|thumb|400px]] | ||
|} | |} | ||
Revision as of 16:07, 27 October 2011
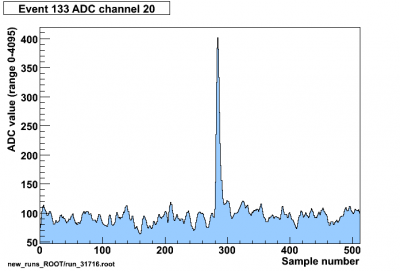
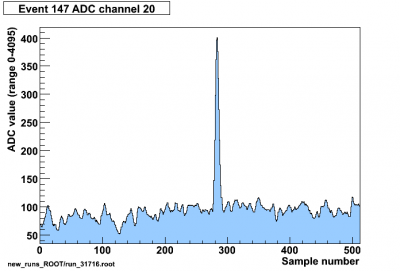
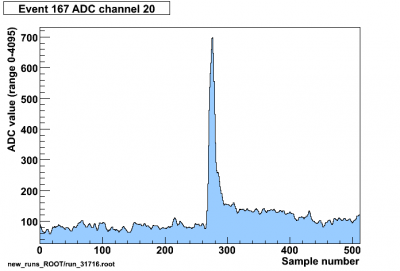
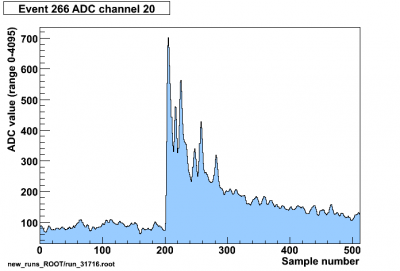
Data from cosmics with 50/50 gas, 2100V
Fit attempt 1
Use pedestal before peak, max peak amplitude, end of peak - this is the first sample with contents > 20 less than its neighbor, starting with the last sample and working forwards. Function fitted to many events for range end-of-peak to final sample was pedestal + 0.14 * maxamp * exp(-0.0056*(x-endpeak)) where x=sample number. The constants were the mean values of the fitted function parameters.
