Difference between revisions of "ASIC meeting June 14, 2010"
(→Performance Plots for the ASIC) |
(→Agenda) |
||
| Line 14: | Line 14: | ||
== Agenda == | == Agenda == | ||
| + | ===Status of the new ASIC=== | ||
| − | ===Performance Plots for the ASIC=== | + | ====Performance Plots for the ASIC at CMU ==== |
The following links go to pages that compare the performance of the older preamplifier | The following links go to pages that compare the performance of the older preamplifier | ||
to the newest version of the ASIC. We note that the interposer board was not used for the | to the newest version of the ASIC. We note that the interposer board was not used for the | ||
| Line 27: | Line 28: | ||
minimum ionizing peak for cosmics to go down by about a factor of three. Oddly, by just about any reasonable measure, it has moved up. We find this extremely confusing. | minimum ionizing peak for cosmics to go down by about a factor of three. Oddly, by just about any reasonable measure, it has moved up. We find this extremely confusing. | ||
*[[Preamp 4: Comparison of cosmic data with original preamp]]' | *[[Preamp 4: Comparison of cosmic data with original preamp]]' | ||
| + | 2050V - cosmics - max amplitude histogram | ||
| + | {| border="1" cellpadding="2" | ||
| + | |width="415pt"|[[Image:cosmic_amplitude_2050V_old_preamp.jpg|thumb|none|400px|old preamp, cosmics, amplitude, 50/50 Ar/CO2, 2050V]] | ||
| + | |width="415pt"|[[Image:cosmic_amplitude_2050V_preamp4.jpg|thumb|none|400px|new preamp, cosmics, amplitude, 50/50 Ar/CO2, 2050V]] | ||
| + | |} | ||
| + | 2050V- cosmics - energy | ||
| + | {| border="1" cellpadding="2" | ||
| + | |width="415pt"|[[Image:cosmic_energy_2050V_old_preamp.jpg|thumb|none|400px|old preamp, cosmics, energy, 50/50 Ar/CO2, 2050V]] | ||
| + | |width="415pt"|[[Image:cosmic_energy_2050V_preamp4.jpg|thumb|none|400px|new preamp, cosmics, energy, 50/50 Ar/CO2, 2050V]] | ||
| + | |} | ||
The following plots are taken with the Fe-55 source for the same pairs of configuration. Here we are limited by a great deal of overflow and saturation in both cases so it is difficult to draw a strong conclusion on were the gain really is on the new ASIC | The following plots are taken with the Fe-55 source for the same pairs of configuration. Here we are limited by a great deal of overflow and saturation in both cases so it is difficult to draw a strong conclusion on were the gain really is on the new ASIC | ||
*[[Preamp 4: Comparison of 55Fe data with original preamp]] | *[[Preamp 4: Comparison of 55Fe data with original preamp]] | ||
| − | ===Efficiency Plots for the CDC=== | + | ====Efficiency Plots for the CDC==== |
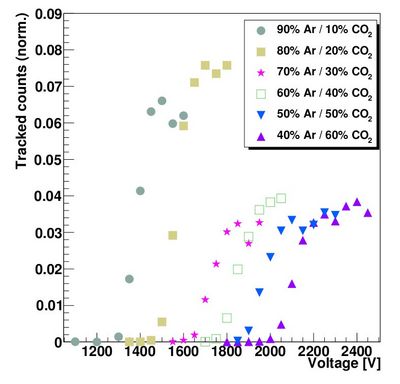
The following plot is taken from our NIM article that shows the chamber efficiency as a function of the high voltage setting for various gas mixtures. As can be seen, for the optimal gas mixture | The following plot is taken from our NIM article that shows the chamber efficiency as a function of the high voltage setting for various gas mixtures. As can be seen, for the optimal gas mixture | ||
(around 50/50), the plateau starts at about 2100 V and there is no efficiency below around 1900V. | (around 50/50), the plateau starts at about 2100 V and there is no efficiency below around 1900V. | ||
| Line 40: | Line 51: | ||
| − | |||
| − | |||
| − | |||
| − | |||
| − | |||
| − | + | 1. Status | |
| − | + | a-gas gain | |
| − | + | b-efficiency | |
| − | + | c-plateau | |
| − | + | d-amplitude and energy histograms with cosmics & Fe-55 | |
| − | + | e-scaling to experiment | |
| − | + | 2. Remaining tests, if any. | |
| + | 3. Schedule to completion | ||
| + | 4. Impact to: | ||
| + | a-detector tests | ||
| + | b-to installation. | ||
== Minutes == | == Minutes == | ||
Revision as of 11:17, 12 June 2010
Contents
Meeting Time and Place
Monday June 11, 2010 at 10:00am At Jefferson Lab, the meeting will be held in room F326-327
Connections
To connect from the outside, please use ESNET
1.) ESNET: 8542553
2.) Phone:
+1-800-377-8846 : US
+1-888-276-7715 : Canada
+1-302-709-8424 : International
then enter participant code: 77438230# (remember the "#")
Agenda
Status of the new ASIC
Performance Plots for the ASIC at CMU
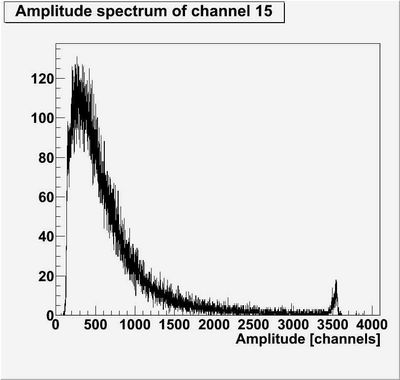
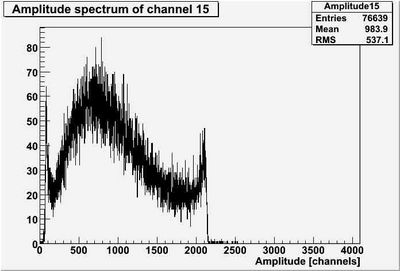
The following links go to pages that compare the performance of the older preamplifier to the newest version of the ASIC. We note that the interposer board was not used for the older preamplifier and that the Struck FADCs we have at CMU are set to a scale such that 1 volt coresponds to about 4000 channels. We note that the new preamplifier does not exceed ~2000 channles here because the output voltage is now (apparently) limited to 0.5V.
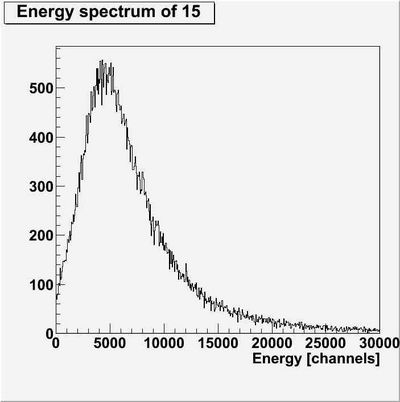
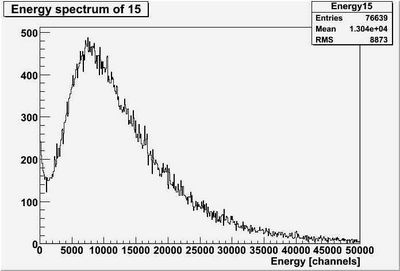
The following sets of plots were taken simply by swapping the old and new preamplifier on the CDC. The high volatge settings were the same and the gas mixture were the same for both. For the case of the cosmics with a reduced gain in the new ASIC, we would expect the location of the minimum ionizing peak for cosmics to go down by about a factor of three. Oddly, by just about any reasonable measure, it has moved up. We find this extremely confusing.
2050V - cosmics - max amplitude histogram
2050V- cosmics - energy
The following plots are taken with the Fe-55 source for the same pairs of configuration. Here we are limited by a great deal of overflow and saturation in both cases so it is difficult to draw a strong conclusion on were the gain really is on the new ASIC
Efficiency Plots for the CDC
The following plot is taken from our NIM article that shows the chamber efficiency as a function of the high voltage setting for various gas mixtures. As can be seen, for the optimal gas mixture (around 50/50), the plateau starts at about 2100 V and there is no efficiency below around 1900V.
1. Status a-gas gain b-efficiency c-plateau d-amplitude and energy histograms with cosmics & Fe-55 e-scaling to experiment 2. Remaining tests, if any. 3. Schedule to completion 4. Impact to: a-detector tests b-to installation.
