Difference between revisions of "GlueX TOF Meeting, May 6, 2020"
From GlueXWiki
(→Agenda) |
(→Agenda) |
||
| Line 9: | Line 9: | ||
# Review of [[GlueX TOF Meeting, April 8, 2020#Minutes|minutes from the last meeting]] | # Review of [[GlueX TOF Meeting, April 8, 2020#Minutes|minutes from the last meeting]] | ||
# Calibration | # Calibration | ||
| − | #* Comparison between TOF survey data and tracking with associated TOF points. The following plots shows tracking data where the dimensions in x and y are the track positions at the TOF plane based on extrapolating the tracks all the way out to the TOF. The colored shadings are the x/y position of the track at the TOF with the color indicating which TOF paddle provided the tof point associated with the track. NO EXPLICIT TOF DATA ENTERS HERE! The horzontal lines indicate the location of the "nominal" TOF paddle positions. The profile data is the mean track position of all tracks along the paddles. AGAIN NO PADDLE DATA IS USED HERE OTHER THAN YES THE PADDLE PROVIDED THE HIT! The three large black dots indicate the location of the survey.<br> | + | #* Comparison between TOF survey data and tracking with associated TOF points. The following plots shows tracking data where the dimensions in x and y are the track positions at the TOF plane based on extrapolating the tracks all the way out to the TOF. The colored shadings are the x/y position of the track at the TOF with the color indicating which TOF paddle provided the tof point associated with the track. NO EXPLICIT TOF DATA ENTERS HERE! The horzontal lines indicate the location of the "nominal" TOF paddle positions. The profile data is the mean track position of all tracks along the paddles. AGAIN NO PADDLE DATA IS USED HERE OTHER THAN YES THE PADDLE PROVIDED THE HIT! The three large black dots indicate the location of the survey.<br> Shown are the data for survey points 1,2 and 3 which are along the horizontal axis between paddle 19 (last 3cm wide) and paddle 20 (first 4.5cm wide). These are above the beam hole. Q indicate the charge of the tracked particle. <br>The survey points are shown in the following picture<br> [[File:TOFsurveypoints.jpg|600px]] <br><br> The first two plots below show the data below the beam line <br> [[File:survey_P19P20_Q1_run71673.gif]] [[File:survey_P19P20_Q-1_run71673.gif]] <br><br> The second two plots below are data from above the beam line <br> [[File:survey_P27P28_Q1_run71673.gif]] [[File:survey_P27P28_Q-1_run71673.gif]] <br><br> The next two plots are data from far below the beam line <br> [[File:survey_P7P8_Q1_run71673.gif]] [[File:survey_P7P8_Q-1_run71673.gif]] <br><br> |
# Software Issues | # Software Issues | ||
# TOF NIM paper | # TOF NIM paper | ||
# Action Item Recap | # Action Item Recap | ||
Revision as of 09:34, 6 May 2020
GlueX Time-of-Flight Meeting
Wednesday, May 6, 2020
10:00 am EDT
BlueJeans: 350 531 998
Agenda
- Announcements
- Review of minutes from the last meeting
- Calibration
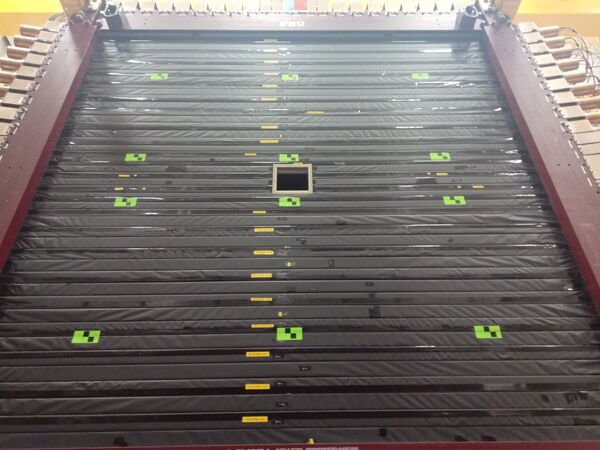
- Comparison between TOF survey data and tracking with associated TOF points. The following plots shows tracking data where the dimensions in x and y are the track positions at the TOF plane based on extrapolating the tracks all the way out to the TOF. The colored shadings are the x/y position of the track at the TOF with the color indicating which TOF paddle provided the tof point associated with the track. NO EXPLICIT TOF DATA ENTERS HERE! The horzontal lines indicate the location of the "nominal" TOF paddle positions. The profile data is the mean track position of all tracks along the paddles. AGAIN NO PADDLE DATA IS USED HERE OTHER THAN YES THE PADDLE PROVIDED THE HIT! The three large black dots indicate the location of the survey.
Shown are the data for survey points 1,2 and 3 which are along the horizontal axis between paddle 19 (last 3cm wide) and paddle 20 (first 4.5cm wide). These are above the beam hole. Q indicate the charge of the tracked particle.
The survey points are shown in the following picture
The first two plots below show the data below the beam line
The second two plots below are data from above the beam line
The next two plots are data from far below the beam line
- Comparison between TOF survey data and tracking with associated TOF points. The following plots shows tracking data where the dimensions in x and y are the track positions at the TOF plane based on extrapolating the tracks all the way out to the TOF. The colored shadings are the x/y position of the track at the TOF with the color indicating which TOF paddle provided the tof point associated with the track. NO EXPLICIT TOF DATA ENTERS HERE! The horzontal lines indicate the location of the "nominal" TOF paddle positions. The profile data is the mean track position of all tracks along the paddles. AGAIN NO PADDLE DATA IS USED HERE OTHER THAN YES THE PADDLE PROVIDED THE HIT! The three large black dots indicate the location of the survey.
- Software Issues
- TOF NIM paper
- Action Item Recap


