Difference between revisions of "Transition to JANA2"
m (→b1pi test) |
(→b1pi test) |
||
| Line 96: | Line 96: | ||
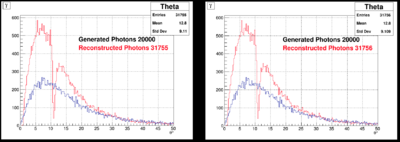
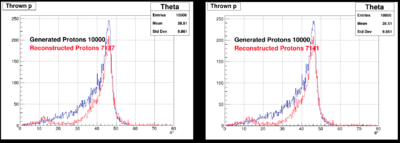
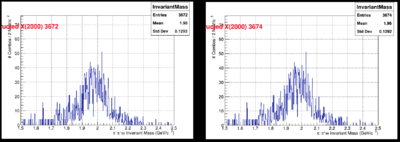
In the following plots, we compare few results from JANA1 (left) and JANA2 (right): | In the following plots, we compare few results from JANA1 (left) and JANA2 (right): | ||
| − | [[File:Jana1_jana2_reconstructed_photons.png|400px]] | + | [[File:Jana1_jana2_reconstructed_photons.png|400px]]<br> |
| − | [[File:Jana1_jana2_reconstructed_protons.png|400px]] | + | [[File:Jana1_jana2_reconstructed_protons.png|400px]]<br> |
[[File:Jana1_jana2_reconstructed_X2000.png|400px]] | [[File:Jana1_jana2_reconstructed_X2000.png|400px]] | ||
Revision as of 16:39, 18 November 2024
Contents
Transition to JANA2
This page will document the transition of the GlueX software stack from JANA1 to JANA2.
Useful Links
- Talk at Fall 2024 Collaboration Meeting (Raiqa): Slides
- Transition guide for developers
- Tools for comparison:
- rootdiff.py compares root files. It is part of this repo: [1]
- compare_hists_dirs.py creates a pdf file with all plots in 2 different files
Discussion Points
- How do we treat halld_sim and hdgeant4 developments for previous run periods? Can we patch old halld_recon versions?
halld_recon
Prerequisite Tests
- Objects: hd_dump
- DTrackTimeBased
- DTrackWireBased
- DBCALShower
- DVertex
- DChargedTrack
- Plugins: hd_root
- monitoring_hists
hd_root -PPLUGINS=monitoring_hists /cache/halld/RunPeriod-2017-01/rawdata/Run030300/hd_rawdata_030300_000.evio
- occupancy_online
hd_root -PPLUGINS=occupancy_online /cache/halld/RunPeriod-2017-01/rawdata/Run030300/hd_rawdata_030300_000.evio
- danarest
hd_root -PPLUGINS=danarest /cache/halld/RunPeriod-2017-01/rawdata/Run030300/hd_rawdata_030300_000.evio
- p2pi_hists, p3pi_hists: Output histograms can be checked with macros HistMacro_p2pi.C, HistMacro_p3pi.C
hd_root -PPLUGINS=p2pi_hists,p3pi_hists /cache/halld/RunPeriod-2017-01/rawdata/Run030300/hd_rawdata_030300_000.evio
- ReactionFilter with at least 2 reactions: jana_test.config, produces two trees
hd_root --config=/group/halld/www/halldweb/html/talks/2024/jana2/jana_test.config /cache/halld/RunPeriod-2017-01/rawdata/Run030300/hd_rawdata_030300_000.evio
- mcthrown_tree (for MC)
Additional Tests
Benchmarking Results
hdgeant4
hdgeant4 models the measurements (detector hits) produced by a generator. It is steered by a control.in file in the local directory and converts the generated hddm file. When control.in and input file are present in the local directory, simply execute
hdgeant4
halld_sim
hdgeant
The same input and control.in that was used for hdgeant4 can also be used for hdgeant(3):
hdgeant
mcsmear
mcsmear models the detector resolution to match the MC simulation results with actual measurements. It can use this input file and can be executed by
mcsmear gen_amp_030730_000_geant4.hddm
b1pi test
The b1pi test runs the full simulation and reconstruction chain for
gamma p -> p X
             X -> b1 pi-
                  b1 -> omega pi+
                        omega -> pi+ pi- pi0
Usage:
 b1pi_test.sh [-n <number of events>] [-t <number of threads>] [-r <run number>]\
   [-v <vertex string>] [-d <b1pi_test script directory>]
The script performs these steps:
- genr8: Event generator, part of the halld_sim repository, output: b1_pi.ascii
- genr8_2_hddm: Convert output of genr8 to hddm file, in halld_sim repository, output: b1_pi.hddm
- hdgeant4: Running simulation with geant4, output: hdgeant4.hddm
- mcsmear: Adding detector effects to simulation, part of halld_sim repo, output: hdgeant_smeared.hddm
- hd_root with danarest plugin: Runnning reconstruction, part of halld_recon, output: dana_rest.hddm
- hd_root with b1pi_hists, monitoring_hists plugins: Analysis, part of halld_recon, output: hd_root.root
- root mk_pics.C: create plots and save them as pdf and gif
Example:
 source /group/halld/Software/build_scripts/gluex_env_boot_jlab.sh
 gxenv /group/halld/www/halldweb/html/halld_versions/version_5.21.1_jana2.xml
 export B1PI_TEST_DIR=/group/halld/Software/hd_utilities/b1pi_test/
 export SEED=123
 export JANA_CALIB_CONTEXT="variation=mc"
 $B1PI_TEST_DIR/b1pi_test.sh -n 10000 -r 30480 -4
In the following plots, we compare few results from JANA1 (left) and JANA2 (right):


