Difference between revisions of "Mini BCAL Channel Study"
(→The setup) |
(→Results) |
||
| (12 intermediate revisions by the same user not shown) | |||
| Line 9: | Line 9: | ||
== The setup == | == The setup == | ||
| − | The pulsar box was a dark light-tight box with a blue LED constantly flashing from the bottom. The SiPM modules are mounted on the top, with a casket and a black cloth to seal off any light leaks into the system, Voltage supplies are given by the BCAL distribution boxes as shown in [[https://halldweb.jlab.org/DocDB/0059/005935/001/EIC%20Mini%20BCAL%20PS%20Setup.pdf Slide 12]]. The | + | # The pulsar box was a dark light-tight box with a blue LED constantly flashing from the bottom. |
| + | # The SiPM modules are mounted on the top, with a casket and a black cloth to seal off any light leaks into the system, | ||
| + | # Voltage supplies are given by the Weiner Crate (ISEG for high voltages and MPOD for low voltages) to the BCAL distribution boxes as shown in [[https://halldweb.jlab.org/DocDB/0059/005935/001/EIC%20Mini%20BCAL%20PS%20Setup.pdf Slide 12]]. Due to instrumental issues with the ISEG controller, Voltages had to be manually set using the knobs and therefore, the Over Bias tests were not able to be performed. | ||
| + | # 2 LEMO cables are then connected from the output channels onto the scope. One cable labelled 'A' (Yellow in the scope) corresponds to the ADC output, while the other cable labelled 'T' (blue in the scope) corresponds to the TDC output | ||
| + | # The output from each of the 16 fADC channels and 12 TDC channels is checked in the oscilloscope for its output characteristics and recorded. | ||
| − | + | The pulsar box is shown below. | |
| + | [[File:miniBCAL-LED-Pulsar-box.jpeg|thumb|400px|left|LED Pulsar Box setup]] [[File:miniBCAL-LED-Setup1.jpeg|thumb|400px|center|LED Pulsar Box setup]] | ||
| − | A table summarizing the result of the test is shown below | + | The input characteristics for the test are summarized in the table below. Each of the module (all channels) was set with a single Voltage. Chris set it using the Knob in the ISEG controller. However, one can set each channel to a different voltage using the Data sheet that was with Chris (<span style="color:red"> I shall add the link to the Datasheet soon </span>) |
| + | |||
| + | |||
| + | {| class="wikitable" style="text-align:center;" | ||
| + | |- style="font-weight:bold;" | ||
| + | ! Module | ||
| + | ! Input Characteristics<br /> | ||
| + | ! Remarks | ||
| + | |- | ||
| + | | [[File:Upstream-49_Module.jpeg|200px|thumb|center|Upstream 49]]<br /> | ||
| + | | HV = 75 V<br />LV = +/- 5 V | ||
| + | | The upstream amplitudes are consistently lower than the Downstream amplitudes. <br />This could indicate that we can potentially increase the HL voltage<br /> | ||
| + | |- | ||
| + | | [[File:Downstream-49_Module.jpeg|200px|thumb|center|Downstream 49]] | ||
| + | | HV = 74 V<br />LV = +/- 5 V | ||
| + | | The Downstream amplitudes are consistent. The amplitudes increase as a function of layer number. <br />This is because of the summing scheme followed in the BCAL. And the signal is simply from LED.<br /> | ||
| + | |- | ||
| + | | Upstream 50 | ||
| + | | HV = 72 V<br />LV = +/- 5 V<br /> | ||
| + | | [[File:U50A3.jpeg|200px|thumb|center|Channel 3 (Channel 4 as well) output amplitudes are nearly 0. This could be due to the input voltage. <br />Chris mentioned he was not able to find the data sheet for this module 50]]<br /> | ||
| + | |- | ||
| + | | Downstream 50 | ||
| + | | HV = 73 V<br />LV = +/- 5 V<br /> | ||
| + | | [[File:D50A3Channel-3.jpeg|200px|thumb|center|Channel 3 (Channel 4 as well) output amplitudes are nearly 0. This could be due to the input voltage. <br />Chris mentioned he was not able to find the datasheet for this module 50]] | ||
| + | |} | ||
| + | |||
| + | Because we were not able to find the exact input Voltage data sheet for Module 50 we decided to perform tests with Module 49. | ||
| + | |||
| + | For Module 50 Both Channel 3 and 4 seem to show similar behaviour, and the bias voltage arrangement is such that Channel 3 and 4 share common voltage lines. This indicates that the input voltages could be the reason for this observation. | ||
| + | |||
| + | == Results == | ||
| + | |||
| + | |||
| + | A table summarizing the result of the test is shown below. Only Module 49 Both Upstream and downstream are tested for all the channels using the same LEMO cables. | ||
| + | Upstream channels output amplitudes are consistently lower than that of the downstream ones. This could be the result of lower Bias voltage for the upstream channels. | ||
| + | Sasha mentioned the OB study can be made after installing the setup in the Hall. However, mentioned it could be useful to know any empirical relation between Pulse amplitude and the Over Bias Voltage (OB). | ||
{| class="wikitable" style="text-align:center;" | {| class="wikitable" style="text-align:center;" | ||
| Line 28: | Line 68: | ||
| AU0 | | AU0 | ||
| [[File:U49A0T0.png|thumb|200px]] | | [[File:U49A0T0.png|thumb|200px]] | ||
| − | | | + | | [[File:P-U49A0.jpeg|thumb|200px]] |
| AD0 | | AD0 | ||
| [[File:D49A0T0.png|thumb|200px]] | | [[File:D49A0T0.png|thumb|200px]] | ||
| − | | | + | | [[File:P-D49A0.jpeg|thumb|200px]] |
|- | |- | ||
| AU1 | | AU1 | ||
| [[File:U49A1T1.png|thumb|200px]] | | [[File:U49A1T1.png|thumb|200px]] | ||
| − | | | + | | [[File:P-U49A1.jpeg|thumb|200px]] |
| AD1 | | AD1 | ||
| [[File:D49A1T1.png|thumb|200px]] | | [[File:D49A1T1.png|thumb|200px]] | ||
| − | | | + | | [[File:P-D49A1.jpeg|thumb|200px]] |
|- | |- | ||
| AU2 | | AU2 | ||
| [[File:U49A2T2.png|thumb|200px]] | | [[File:U49A2T2.png|thumb|200px]] | ||
| − | | | + | | [[File:P-U49A2.jpeg|thumb|200px]] |
| AD2 | | AD2 | ||
| [[File:D49A2T2.png|thumb|200px]] | | [[File:D49A2T2.png|thumb|200px]] | ||
| − | | | + | | [[File:P-D49A2.jpeg|thumb|200px]] |
|- | |- | ||
| AU3 | | AU3 | ||
| [[File:U49A3T3.png|thumb|200px]] | | [[File:U49A3T3.png|thumb|200px]] | ||
| − | | | + | | [[File:P-U49A3.jpeg|thumb|200px]] |
| AD3 | | AD3 | ||
| [[File:D49A3T3.png|thumb|200px]] | | [[File:D49A3T3.png|thumb|200px]] | ||
| − | | | + | | [[File:P-D49A3.jpeg|thumb|200px]] |
|- | |- | ||
| AU4 | | AU4 | ||
| [[File:U49A4T4.png|thumb|200px]] | | [[File:U49A4T4.png|thumb|200px]] | ||
| − | | | + | | [[File:P-U49A4.jpeg|thumb|200px]] |
| AD4 | | AD4 | ||
| [[File:D49A4T4.png|thumb|200px]] | | [[File:D49A4T4.png|thumb|200px]] | ||
| − | | | + | | [[File:P-D49A4.jpeg|thumb|200px]] |
|- | |- | ||
| AU5 | | AU5 | ||
| [[File:U49A5T5.png|thumb|200px]] | | [[File:U49A5T5.png|thumb|200px]] | ||
| − | | | + | | [[File:P-U49A5.jpeg|thumb|200px]] |
| AD5 | | AD5 | ||
| [[File:D49A5T5.png|thumb|200px]] | | [[File:D49A5T5.png|thumb|200px]] | ||
| − | | | + | | [[File:P-D49A5.jpeg|thumb|200px]] |
|- | |- | ||
| AU6 | | AU6 | ||
| [[File:U49A6T6.png|thumb|200px]] | | [[File:U49A6T6.png|thumb|200px]] | ||
| − | | | + | | [[File:P-U49A6.jpeg|thumb|200px]] |
| AD6 | | AD6 | ||
| [[File:D49A6T6.png|thumb|200px]] | | [[File:D49A6T6.png|thumb|200px]] | ||
| − | | | + | | [[File:P-D49A6.jpeg|thumb|200px]] |
|- | |- | ||
| AU7 | | AU7 | ||
| [[File:U49A7T7.png|thumb|200px]] | | [[File:U49A7T7.png|thumb|200px]] | ||
| − | | | + | | [[File:P-U49A7.jpeg|thumb|200px]] |
| AD7 | | AD7 | ||
| [[File:D49A7T7.png|thumb|200px]] | | [[File:D49A7T7.png|thumb|200px]] | ||
| − | | | + | | [[File:P-D49A7.jpeg|thumb|200px]] |
|- | |- | ||
| AU8 | | AU8 | ||
| [[File:U49A8T8.png|thumb|200px]] | | [[File:U49A8T8.png|thumb|200px]] | ||
| − | | | + | | [[File:P-U49A8.jpeg|thumb|200px]] |
| AD8 | | AD8 | ||
| [[File:D49A8T8.png|thumb|200px]] | | [[File:D49A8T8.png|thumb|200px]] | ||
| − | | | + | | [[File:P-D49A8.jpeg|thumb|200px]] |
|- | |- | ||
| AU9 | | AU9 | ||
| [[File:U49A9T9.png|thumb|200px]] | | [[File:U49A9T9.png|thumb|200px]] | ||
| − | | | + | | [[File:P-U49A9.jpeg|thumb|200px]] |
| AD9 | | AD9 | ||
| [[File:D49A9T9.png|thumb|200px]] | | [[File:D49A9T9.png|thumb|200px]] | ||
| − | | | + | | [[File:P-D49A9.jpeg|thumb|200px]] |
|- | |- | ||
| AU10 | | AU10 | ||
| [[File:U49A10T10.png|thumb|200px]] | | [[File:U49A10T10.png|thumb|200px]] | ||
| − | | | + | | [[File:P-U49A10.jpeg|thumb|200px]] |
| AD10 | | AD10 | ||
| [[File:D49A10T10.png|thumb|200px]] | | [[File:D49A10T10.png|thumb|200px]] | ||
| − | | | + | | [[File:P-D49A10.jpeg|thumb|200px]] |
|- | |- | ||
| AU11 | | AU11 | ||
| [[File:U49A11T11.png|thumb|200px]] | | [[File:U49A11T11.png|thumb|200px]] | ||
| − | | | + | | [[File:P-U49A11.jpeg|thumb|200px]] |
| AD11 | | AD11 | ||
| [[File:D49A11T11.png|thumb|200px]] | | [[File:D49A11T11.png|thumb|200px]] | ||
| − | | | + | | [[File:P-D49A11.jpeg|thumb|200px]] |
|- | |- | ||
| AU12 | | AU12 | ||
| [[File:U49A12.png|thumb|200px]] | | [[File:U49A12.png|thumb|200px]] | ||
| − | | | + | | [[File:P-U49A12.jpeg|thumb|200px]] |
| AD12 | | AD12 | ||
| [[File:D49A12.png|thumb|200px]] | | [[File:D49A12.png|thumb|200px]] | ||
| − | | | + | | [[File:P-D49A12.jpeg|thumb|200px]] |
|- | |- | ||
| AU13 | | AU13 | ||
| [[File:U49A13.png|thumb|200px]] | | [[File:U49A13.png|thumb|200px]] | ||
| − | | | + | | [[File:P-U49A13.jpeg|thumb|200px]] |
| AD13 | | AD13 | ||
| [[File:D49A13.png|thumb|200px]] | | [[File:D49A13.png|thumb|200px]] | ||
| − | | | + | | [[File:P-D49A13.jpeg|thumb|200px]] |
|- | |- | ||
| AU14 | | AU14 | ||
| [[File:U49A14.png|thumb|200px]] | | [[File:U49A14.png|thumb|200px]] | ||
| − | | | + | | [[File:P-U49A14.jpeg|thumb|200px]] |
| AD14 | | AD14 | ||
| [[File:D49A14.png|thumb|200px]] | | [[File:D49A14.png|thumb|200px]] | ||
| − | | | + | | [[File:P-D49A14.jpeg|thumb|200px]] |
|- | |- | ||
| AU15 | | AU15 | ||
| [[File:U49A15.png|thumb|200px]] | | [[File:U49A15.png|thumb|200px]] | ||
| − | | | + | | [[File:P-U49A15.jpeg|thumb|200px]] |
| AD15 | | AD15 | ||
| [[File:D49A15.png|thumb|200px]] | | [[File:D49A15.png|thumb|200px]] | ||
| − | | | + | | [[File:P-D49A15.jpeg|thumb|200px]] |
|} | |} | ||
Latest revision as of 18:38, 5 March 2023
The mini BCAL Module tests
On 3rd March 2023, Chris set up a LED pulsar box to verify the working of the SiPM modules that will be used for the mini BCAL EIC test.
- Module-49 and Module-50 used are spares for the BCAL modules for 2011 that were tested during this study.
- Module-50 was tested however, channels 3 and 4 showed very small amplitudes for both Upstream and downstream, probably indicating that the bias voltage set were not right for them.
The setup
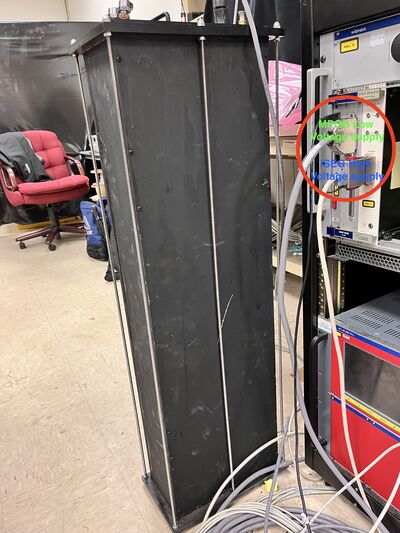
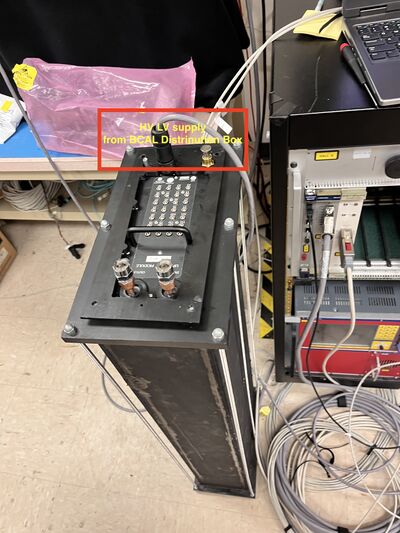
- The pulsar box was a dark light-tight box with a blue LED constantly flashing from the bottom.
- The SiPM modules are mounted on the top, with a casket and a black cloth to seal off any light leaks into the system,
- Voltage supplies are given by the Weiner Crate (ISEG for high voltages and MPOD for low voltages) to the BCAL distribution boxes as shown in [Slide 12]. Due to instrumental issues with the ISEG controller, Voltages had to be manually set using the knobs and therefore, the Over Bias tests were not able to be performed.
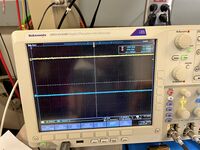
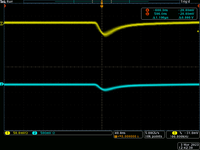
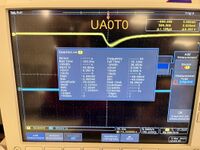
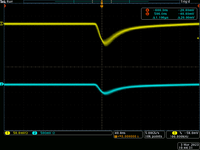
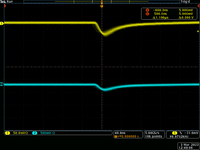
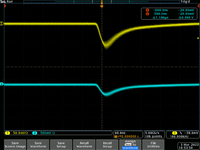
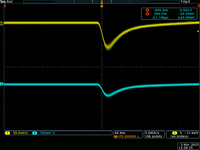
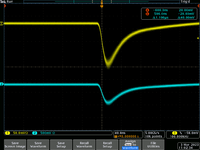
- 2 LEMO cables are then connected from the output channels onto the scope. One cable labelled 'A' (Yellow in the scope) corresponds to the ADC output, while the other cable labelled 'T' (blue in the scope) corresponds to the TDC output
- The output from each of the 16 fADC channels and 12 TDC channels is checked in the oscilloscope for its output characteristics and recorded.
The pulsar box is shown below.
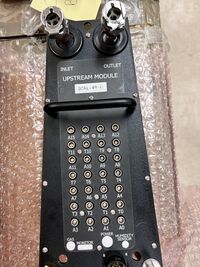
The input characteristics for the test are summarized in the table below. Each of the module (all channels) was set with a single Voltage. Chris set it using the Knob in the ISEG controller. However, one can set each channel to a different voltage using the Data sheet that was with Chris ( I shall add the link to the Datasheet soon )
| Module | Input Characteristics |
Remarks |
|---|---|---|
| |
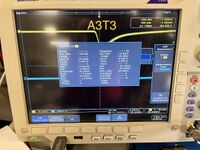
HV = 75 V LV = +/- 5 V |
The upstream amplitudes are consistently lower than the Downstream amplitudes. This could indicate that we can potentially increase the HL voltage |
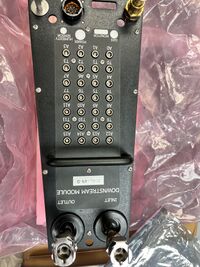
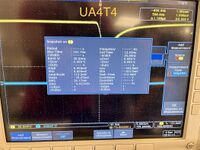
| HV = 74 V LV = +/- 5 V |
The Downstream amplitudes are consistent. The amplitudes increase as a function of layer number. This is because of the summing scheme followed in the BCAL. And the signal is simply from LED. | |
| Upstream 50 | HV = 72 V LV = +/- 5 V |
|
| Downstream 50 | HV = 73 V LV = +/- 5 V |
Because we were not able to find the exact input Voltage data sheet for Module 50 we decided to perform tests with Module 49.
For Module 50 Both Channel 3 and 4 seem to show similar behaviour, and the bias voltage arrangement is such that Channel 3 and 4 share common voltage lines. This indicates that the input voltages could be the reason for this observation.
Results
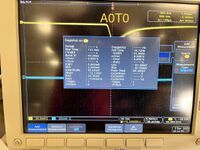
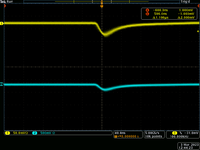
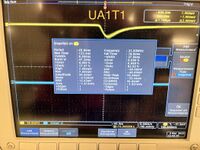
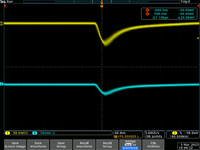
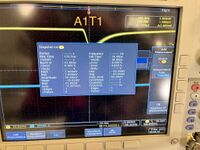
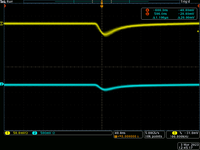
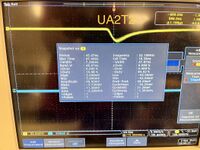
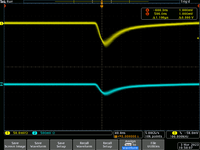
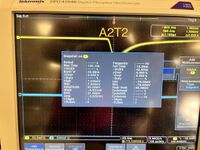
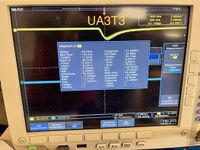
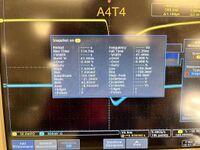
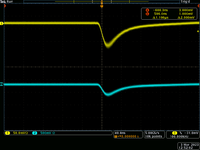
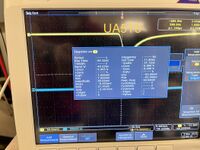
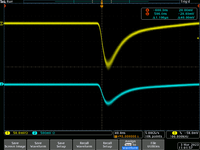
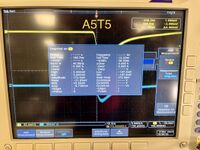
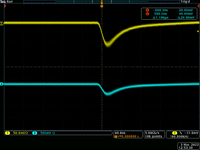
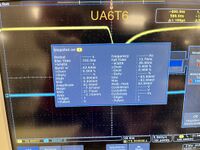
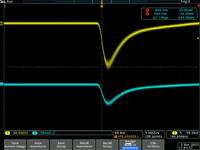
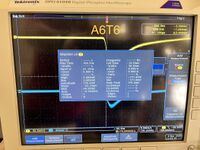
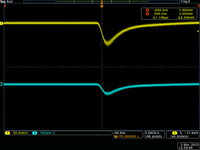
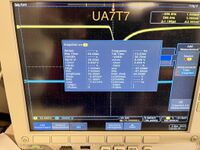
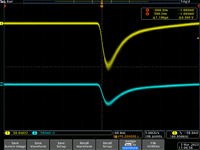
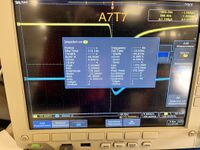
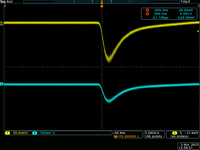
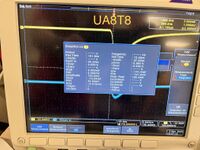
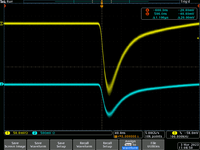
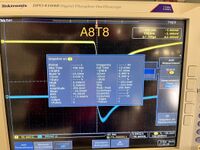
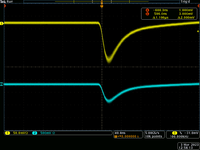
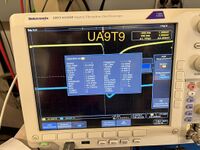
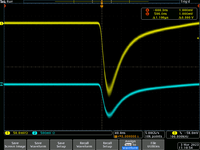
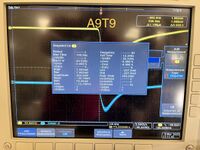
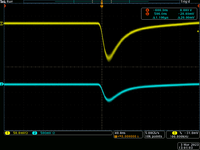
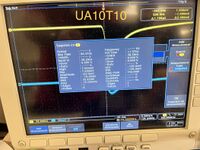
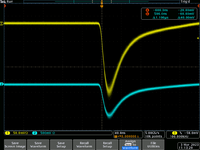
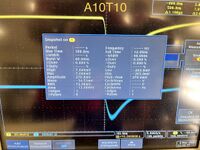
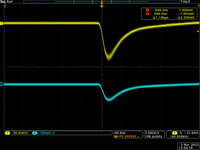
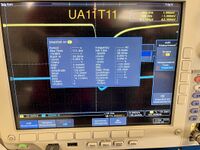
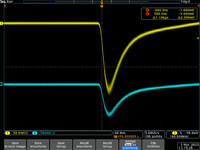
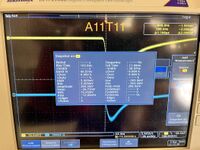
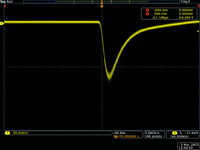
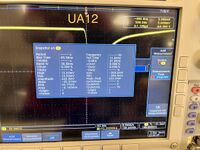
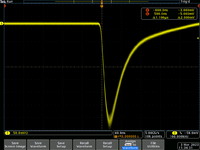
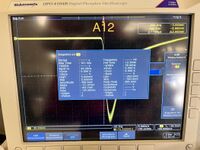
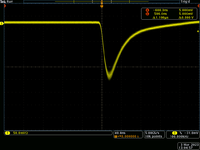
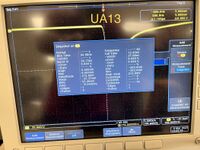
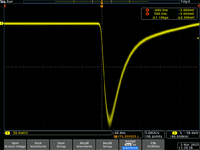
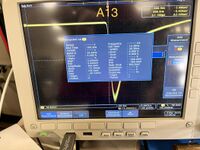
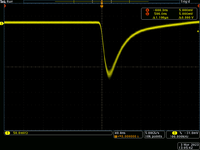
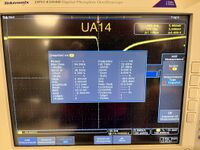
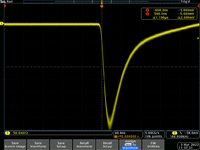
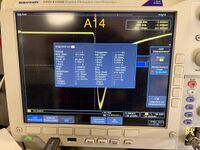
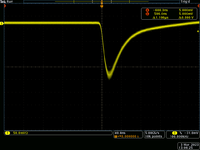
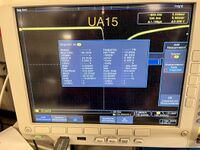
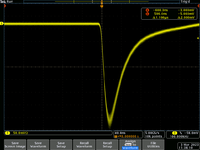
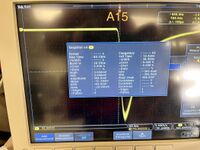
A table summarizing the result of the test is shown below. Only Module 49 Both Upstream and downstream are tested for all the channels using the same LEMO cables. Upstream channels output amplitudes are consistently lower than that of the downstream ones. This could be the result of lower Bias voltage for the upstream channels. Sasha mentioned the OB study can be made after installing the setup in the Hall. However, mentioned it could be useful to know any empirical relation between Pulse amplitude and the Over Bias Voltage (OB).
| Upstream Channel | Upstream Signal (Supply 74 V) | Upstream Properties | Downstream Channel | Downstream Signal (Supply 74 V) | Downstream Properties |
|---|---|---|---|---|---|
| AU0 | AD0 | ||||
| AU1 | AD1 | ||||
| AU2 | AD2 | ||||
| AU3 | AD3 | ||||
| AU4 | AD4 | ||||
| AU5 | AD5 | ||||
| AU6 | AD6 | ||||
| AU7 | AD7 | ||||
| AU8 | AD8 | ||||
| AU9 | AD9 | ||||
| AU10 | AD10 | ||||
| AU11 | AD11 | ||||
| AU12 | AD12 | ||||
| AU13 | AD13 | ||||
| AU14 | AD14 | ||||
| AU15 | AD15 |
