ADC data
ADC data
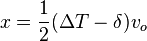
Given that the center of the paddle is x=0 and +x is to the left and -x is to the right we have the following quantities.
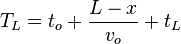
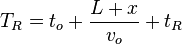
- From TDC: with L the length of the paddle,
 the time of flight of the particle,
  the effective speed of light in the paddle
  is the internal delay including all cables, PMT transit times ect. and same for
-

- From ADC: with
 the original energy deposition, d the attenuation length and
  the light transmission through all couplings including the gain of the PMT and attenuation in the cables. L and R refer to left and right.
-
- Note: The values
 are the measured quantities. And in the following the time measurements are corrected by the relative offsets derived from the calibration procedure. But they have not been corrected for walk.
Now we can plot the x information from the TDC against the x information from the ADC:

fitting the slope will result in the attenuation length d and the horizontal shift is the ration of the two epsilons.
And also the Energy vs. the X-Pos of the ADC:

the position of the minimum ionizing peak can be determined by a projection to the vertical axis. The location of the peak varies from paddle to paddle.

Alternatively the energies  can be plotted separately but requiring that
  is close to zero meaning that the particle passed though the paddle at or close to the center so both sides see the same amount of light modulo light coupling, detection efficiency and gain. This approach lead to the following two plots:

