Difference between revisions of "ADC data"
From GlueXWiki
(→ADC data) |
(→ADC data) |
||
| Line 14: | Line 14: | ||
Now we can plot the x information from the TDC against the x information from the ADC: | Now we can plot the x information from the TDC against the x information from the ADC: | ||
| − | + | *[[File:paddle33_xTvsxE.gif|400px|tumb|| X-pos from TDC vs X-pos from ADC]] | |
| + | *fitting the slope will result in the attenuation length d | ||
And also the Energy vs. the X-Pos of the ADC: | And also the Energy vs. the X-Pos of the ADC: | ||
| − | + | *[[File:paddle33_EvsxE.gif|400px|tumb|| E0 vs X-pos from ADC]] | |
| + | *the position of the minimum ionizing peak can be determined by a projection to the vertical axis. The location of the peak varies from paddle to paddle. | ||
| + | *[[File:adc_E33.gif|400px|tumb|| E0]] | ||
Revision as of 17:47, 18 May 2015
ADC data
Given that the center of the paddle is x=0 and +x is to the left and -x is to the right we have the following quantities.
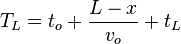
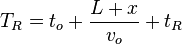
- From TDC: with L the length of the paddle,
 the time of flight of the particle,
  the effective speed of light in the paddle
  is the internal delay including all cables, PMT transit times ect. and same for
-

- From ADC: with
 the original energy deposition, d the attenuation length and
  the light transmission through all couplings including the gain of the PMT and attenuation in the cables. L and R refer to left and right.
-
Now we can plot the x information from the TDC against the x information from the ADC:
- fitting the slope will result in the attenuation length d

And also the Energy vs. the X-Pos of the ADC:
- the position of the minimum ionizing peak can be determined by a projection to the vertical axis. The location of the peak varies from paddle to paddle.