22 February 2008
Shaper board
As mentioned before there is a problem with three channels on the shaper board - they show a 10x lower gain. Although it is not clear what is causing this Gerard will send a new board with a slightly different gain.
Clock
Kim told us she will send a 125 MHz clock to CMU earliest in the first week of March.
Trigger
In this setup we will are reading out the trigger using one channel of the fADCs. The block pulse coming out of the coincidence unit is attenuated and shaped (against jitter) using a device Gerard gave us. Out of this signal a differential signal is made using another device (also from Gerard). This signal is injected in the shaper board and then read out by the fADC. The real trigger (a NIM signal going to the STOP input on the fADC) is basically the delayed output from the coincidence unit.
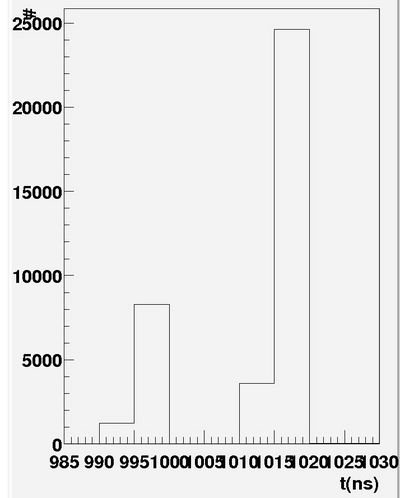
A straight line is fit to the rising edge of the trigger signal and the zero crossing (in ns) is dumped into the histogram shown in figure 3.1.
One can see too peaks that are 20 ns away from each other. The early peak contains almost 1/3 of the events. For now we do not worry too much because we have other problems.
Drift time spectra
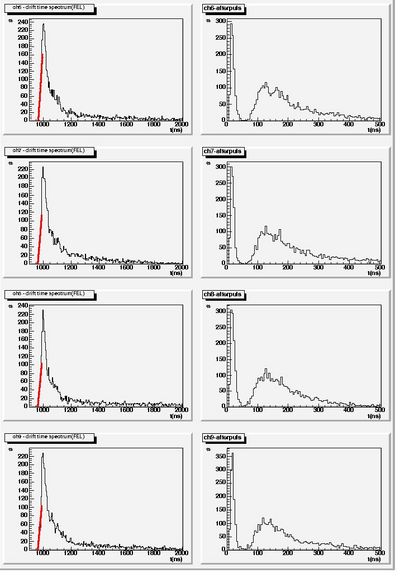
There is a problem with the (minimum) drift time spectra we have for a while. A GARFIELD simulation told us that the maximum drift time is 200 ns. In figure 4.1 on the left side 4 drift time spectra are shown (4 different channels). Two features are not understood:
- The sharp spike in the beginning
- There is no hard cut-off (edge of the straw), instead there is a long tail.
On The right side of figure 4.1 the drift time spectra of the signal coming after the first signal is plotted, the x-axis unit is ns after the first signal. There is a spike close to zero, these are actually not after pulses but probably belong to the first signal. There is also a peak (with a long tail) around 140 ns. This more or less equals 2x the length of the cable between CDC and Shaper board. Those are most likely reflections.
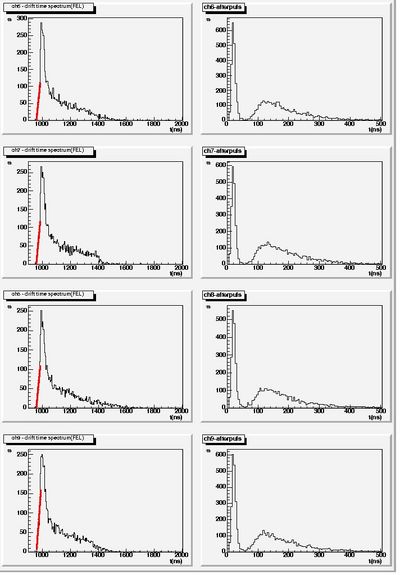
All previous data was taken with cosmic rays going through the middle of the straws. Let's see what happens if we move the trigger scintillators to the end (or beginning) of the straws and remake
figure 4.1. This is shown in figure 4.2.


